

This script provides a complete framework for following trends using Dynamic Price Zones (DPZs). It worked great, especially on those assets which are sufficiently liquid and don’t go through random spikes.
Since it is a trend-following system, it works well during trends. However, I cannot claim any numbers since the execution requires some discretion at the user’s end. The framework can also be combined with other technical tools such as trend lines to increase its efficacy.
Features
Dynamic Price Zones
- Dynamic Price Zones (DPZ) are determined using a proprietary logic that incorporates price movement and certain other factors.
- These zones change more rapidly than conventional support and resistance (S/R) zones, which is why I have named them “Dynamic”.
- DPZs can serve as support and resistance zones and help with trend identification to some extent.
- The upper boundary of a zone is called Dynamic Price Zone High (DPZ-H), while the lower boundary is called Dynamic Price Zone Low (DPZ-L).
Colour Bars
- Candle colours are based on a separate logic, independent of dynamic price zones.
- These are not the traditional moving average-based coloured bars, which is evident from the presence of uncoloured bars in between.
- Uncoloured bars indicate periods of uncertain trends.
- Colour functionality helps in smoothening the trend and assists in riding it for as long as possible.
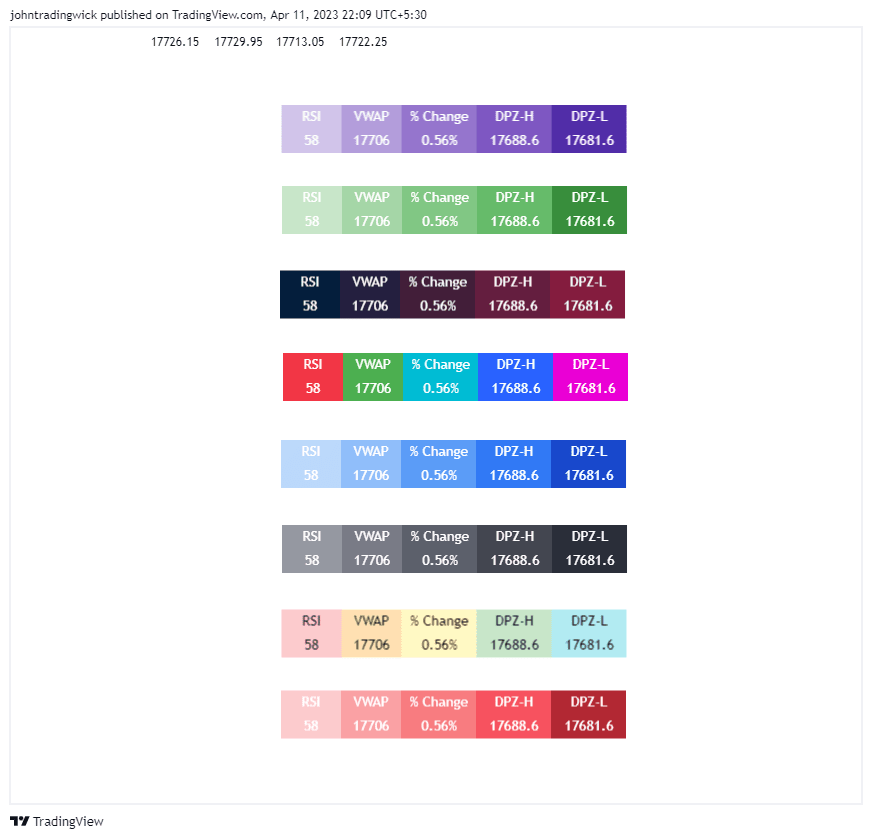
Stats Table
- RSI
- VWAP
- % Change from the previous day’s closing
- Dynamic Price Zone High (DPZ-H) value
- Dynamic Price Zone Low (DPZ-L) value
Settings
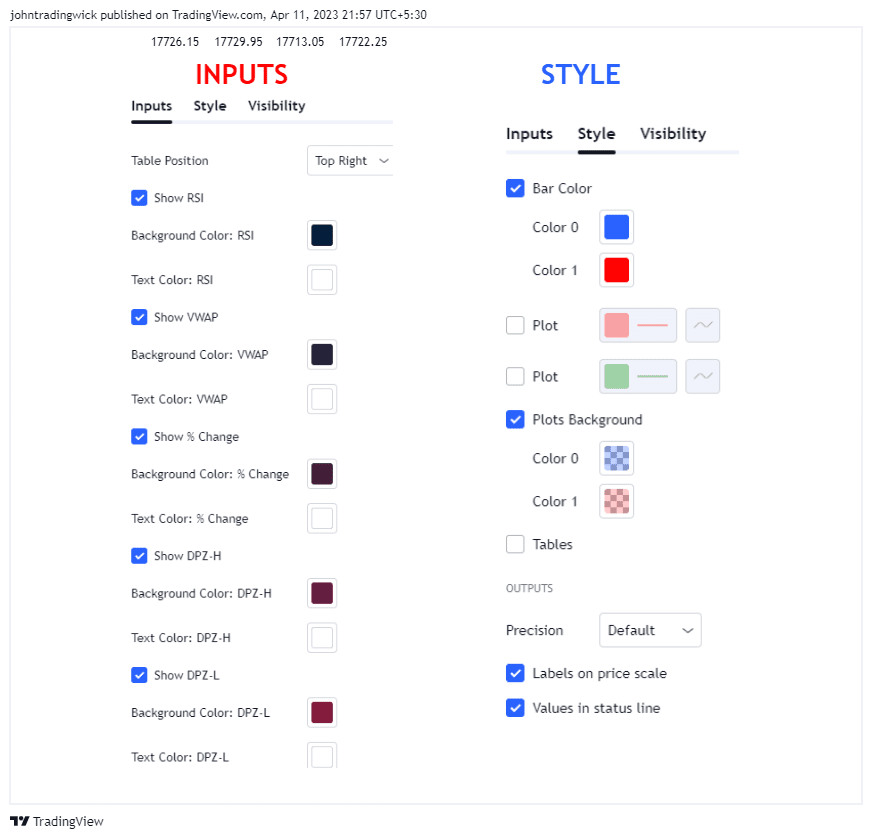
- DPZs are displayed as horizontal lines with background fill by default, but users can toggle lines and background fill on or off.
- Bar colours can be customized according to user preferences.
- The table can be enabled or disabled based on user input.
- The position of the table can be changed based on 4 available options: Top Left, Top Right, Bottom Left, and Bottom Right.
- Users can toggle individual table fields on or off. For example: If the user wants to hide “Vwap” and “%Change” values, he can turn them off. In that case, only 3 fields will be displayed on the table without occupying additional space.
- Background and text colours for each field of the table can be customized based on user preferences.
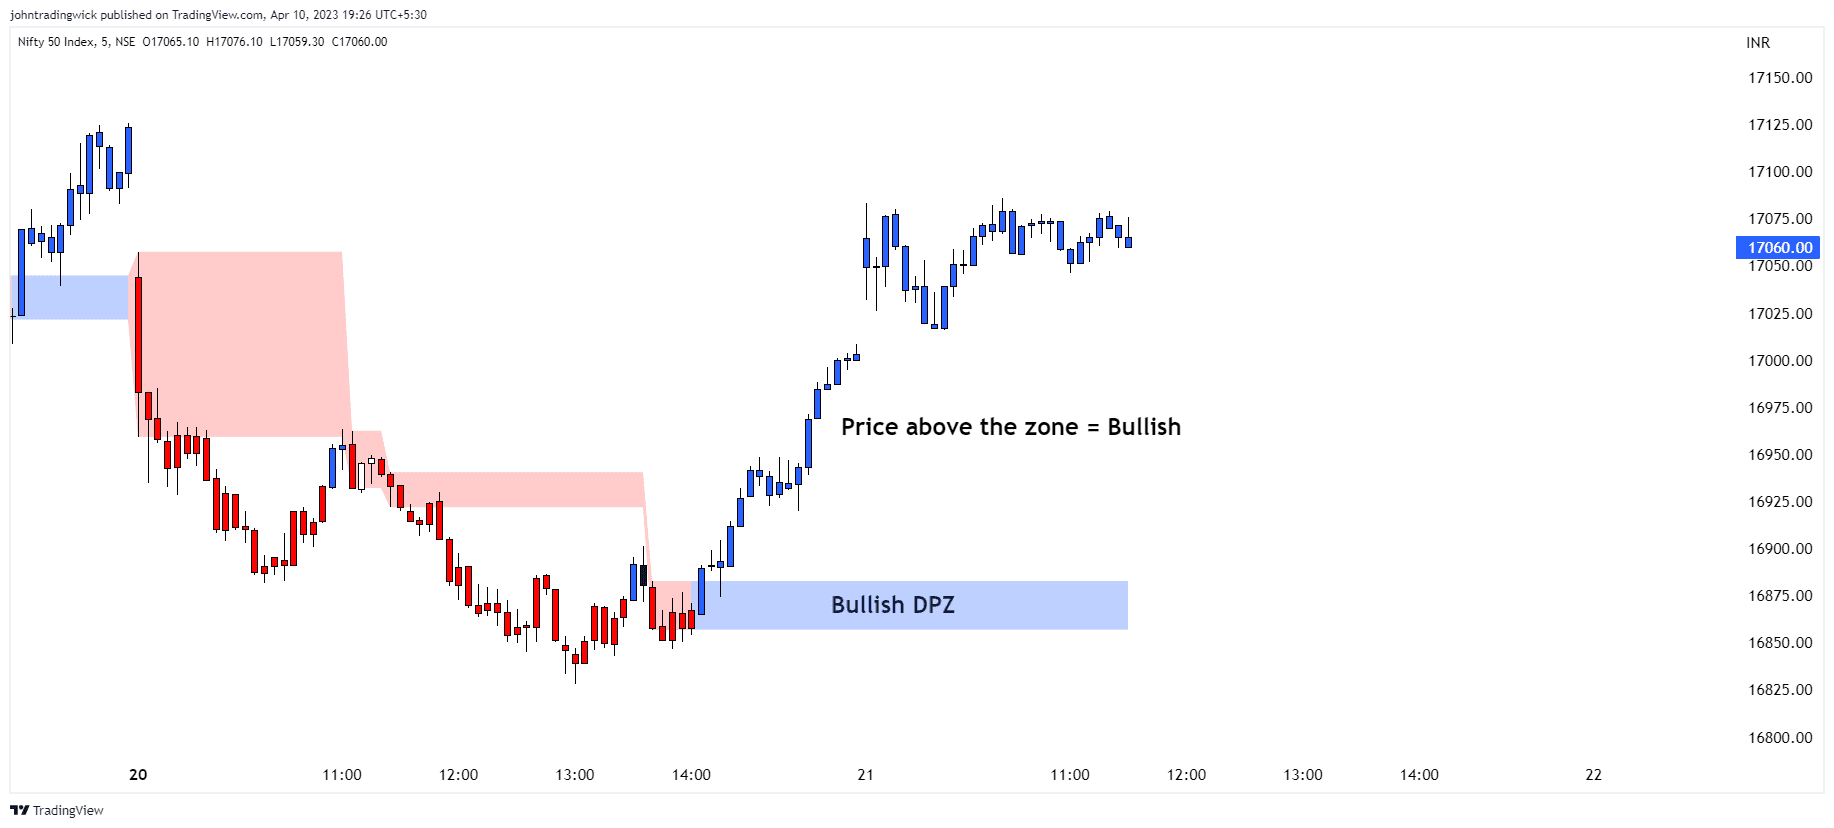
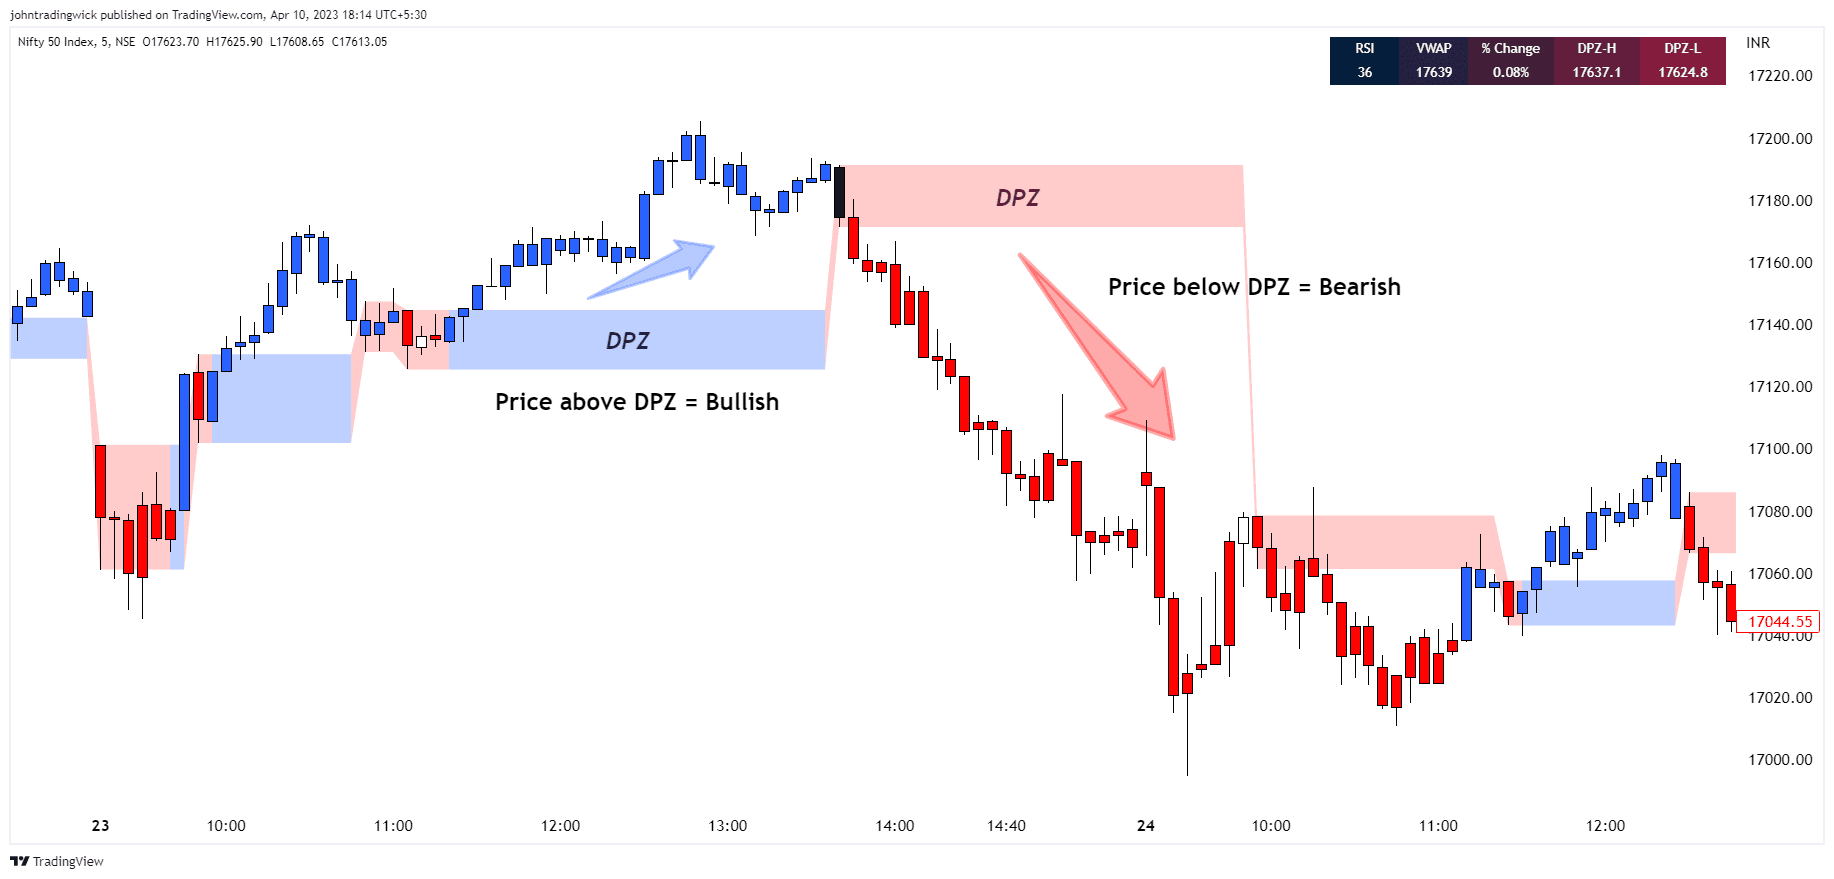
How to Use the Dynamic Price Zones:
- When the price is above a DPZ, it indicates a bullish signal, suggesting the possibility of higher prices. These zones are termed Bullish DPZs.
- Conversely, if the price is below a DPZ, it signals a bearish trend, with an expectation of lower prices. These zones are termed Bearish DPZs.
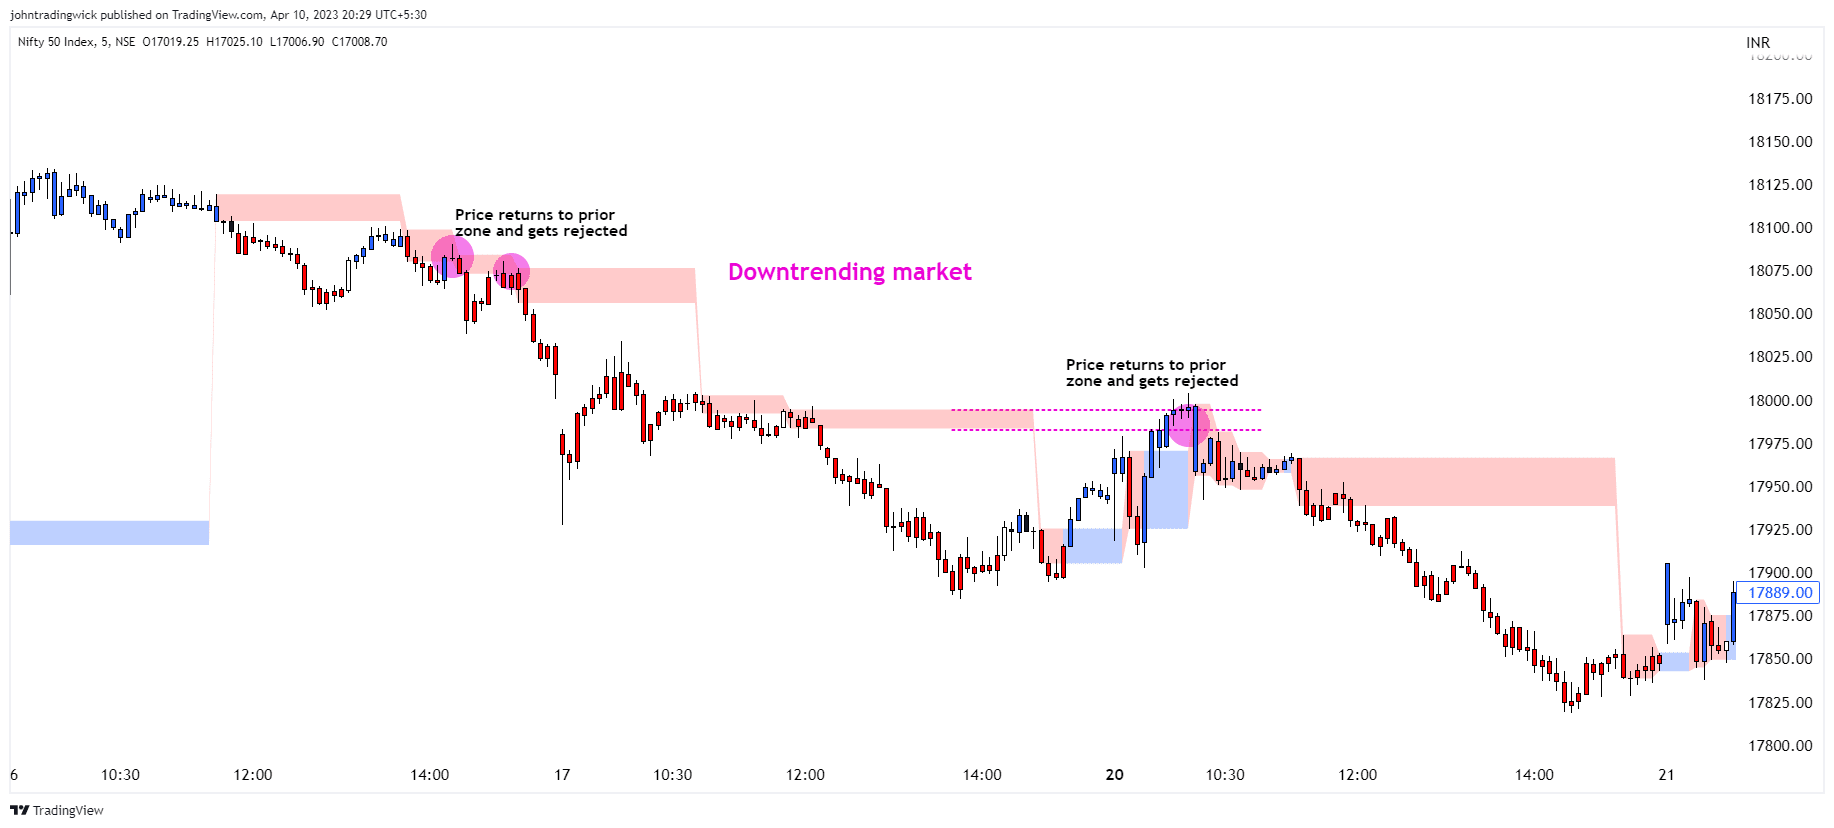
- In a trending market, when the price returns to a previous DPZ, it can present a trading opportunity in the direction of the prior trend (e.g., if the market is falling and the price returns to a previous DPZ, it is likely to reject it).
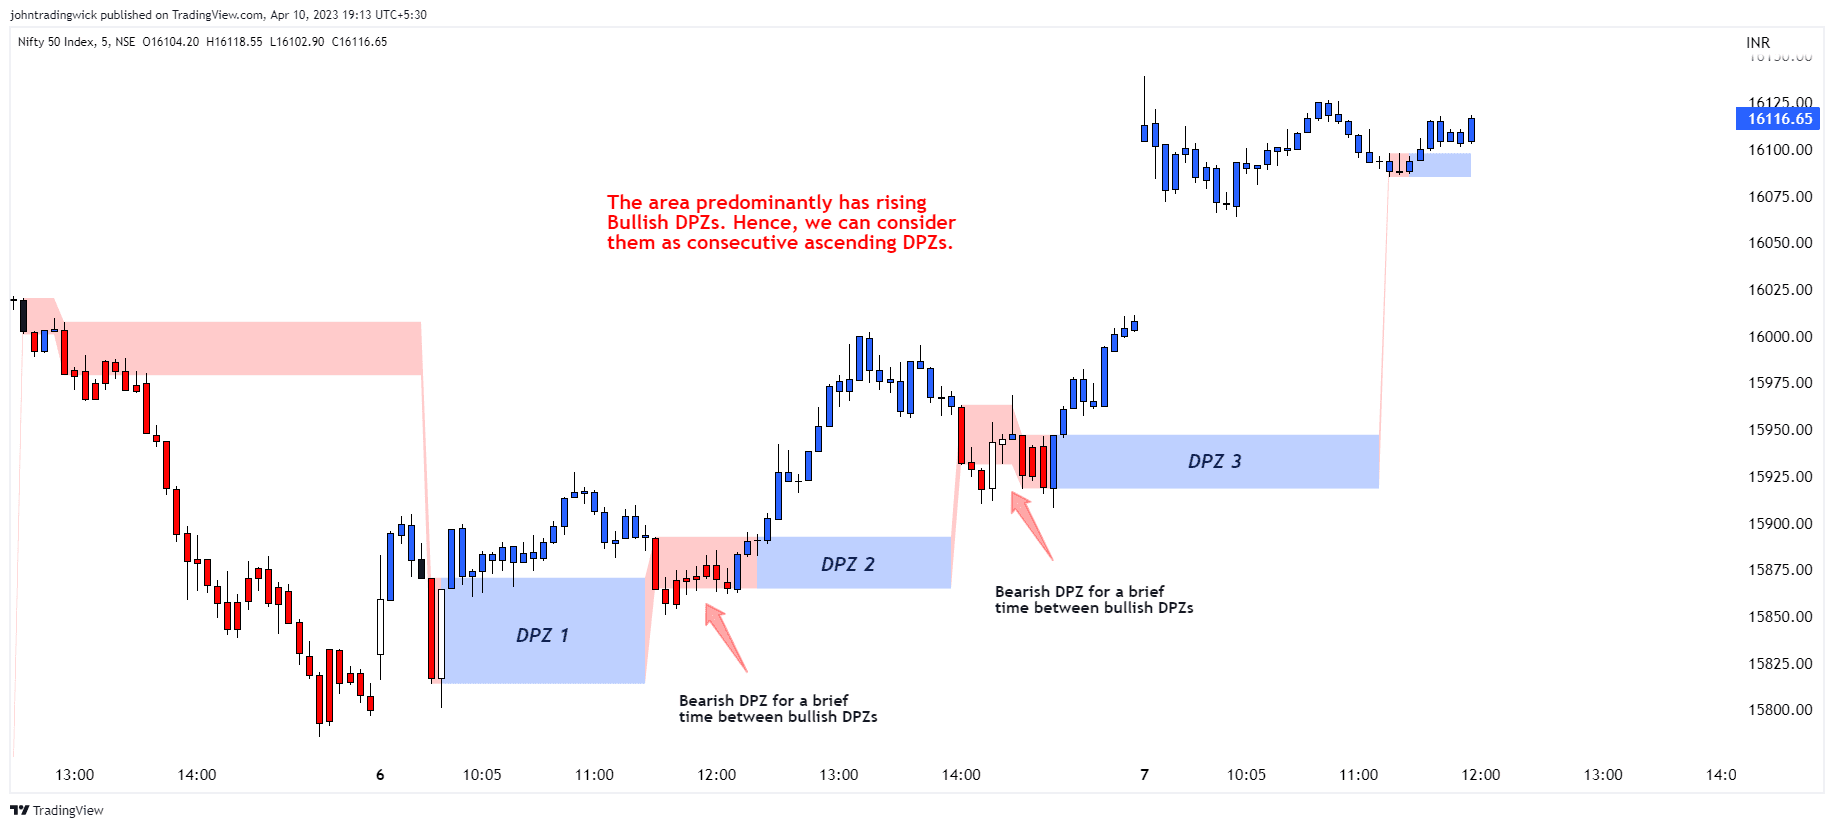
- Consecutive ascending DPZs indicate a shift in buyers from lower to higher levels and can provide buying opportunities. This also indicates a period of a strong bullish trend.

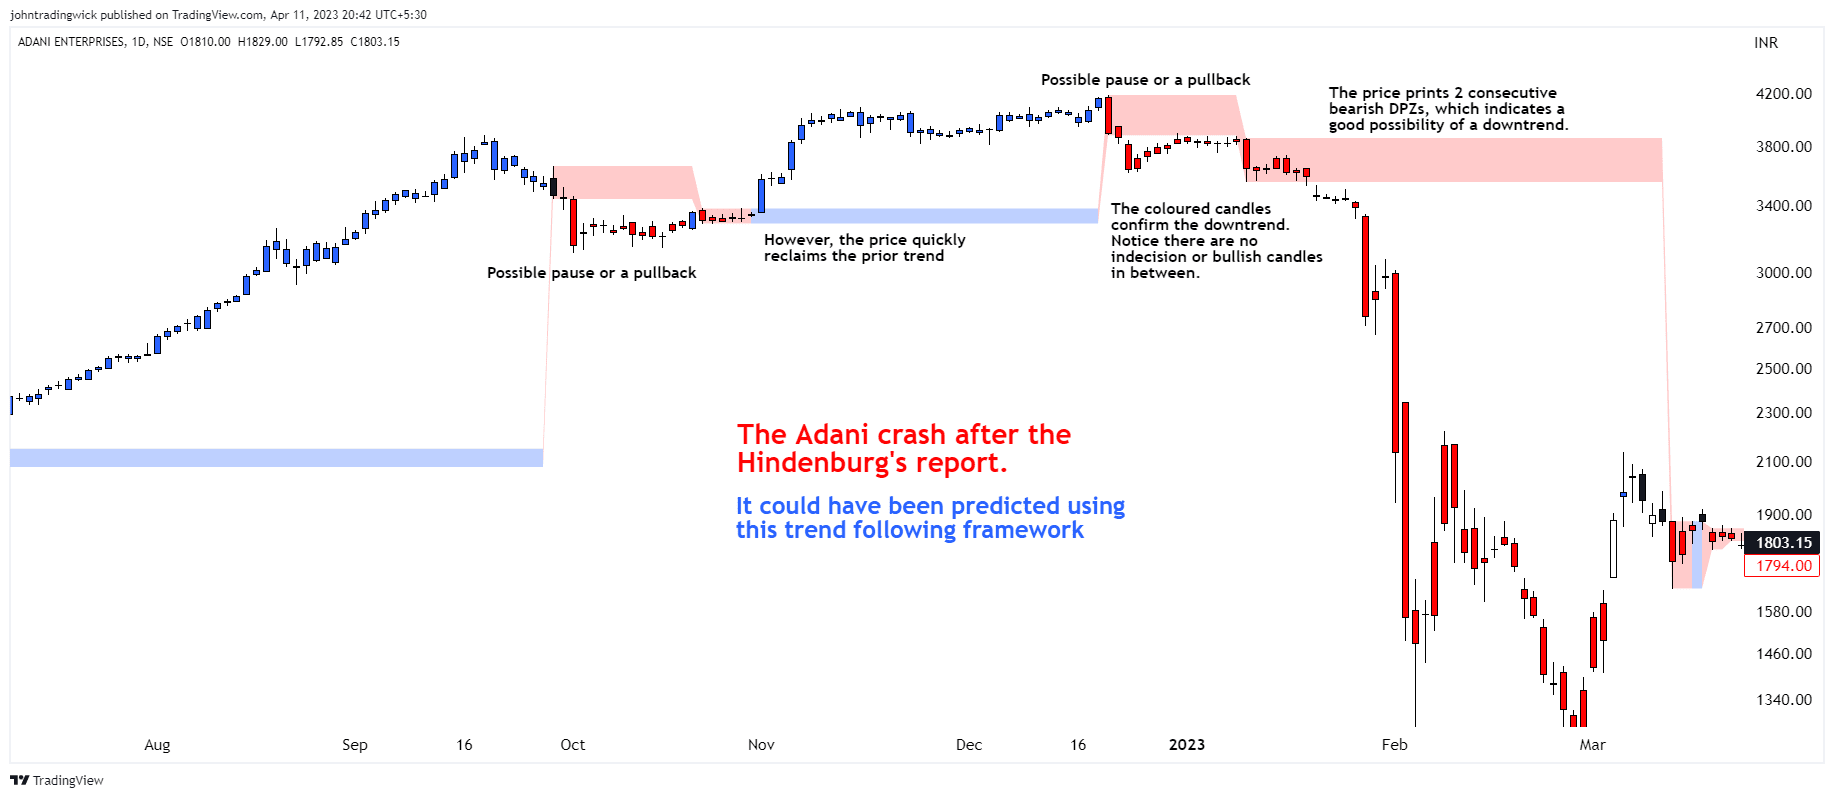
- Similarly, consecutive descending DPZs indicate a shift in sellers from higher to lower levels and can provide selling opportunities. This also indicates a period of a strong bearish trend.

- Please note that we need to be flexible while determining the consecutive zones. For example: There may be a few smaller bearish DPZs in between the bullish DPZs but if the area is dominated by the bullish DPZs then we can consider the zones as consecutive. Similar is true for bearish consecutive zones.
- Closely stacked or adjacent zones suggest that prices will likely remain within a range, moving sideways.

- Wider zones act as big hurdles and, the price may struggle to cross them. They may also lead to a sideways movement.

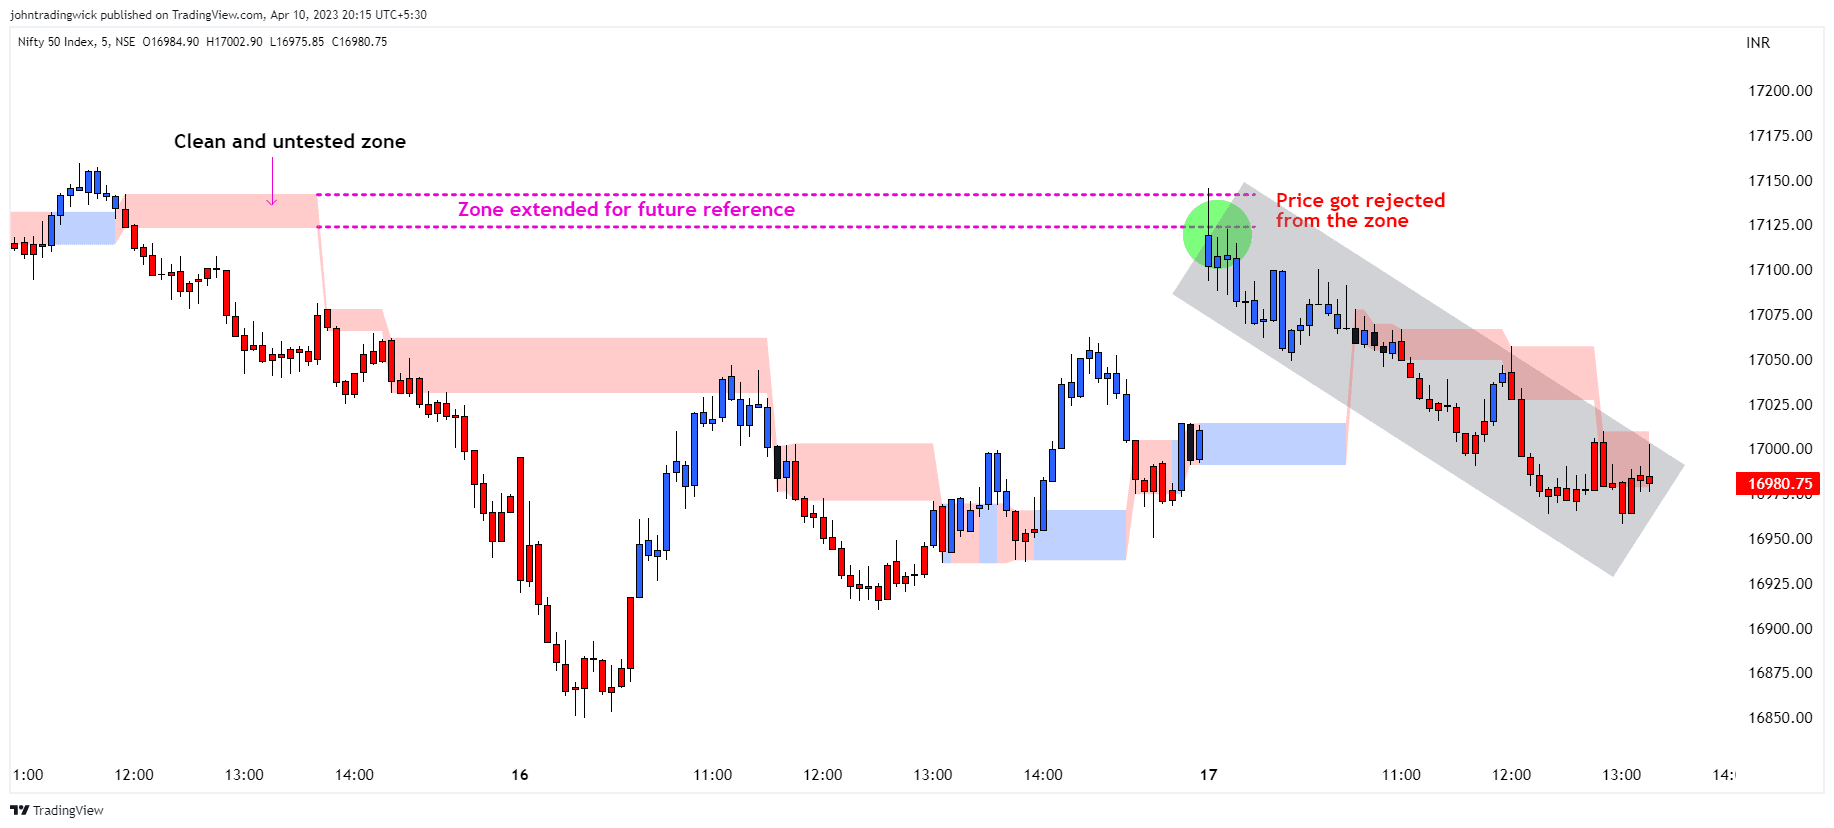
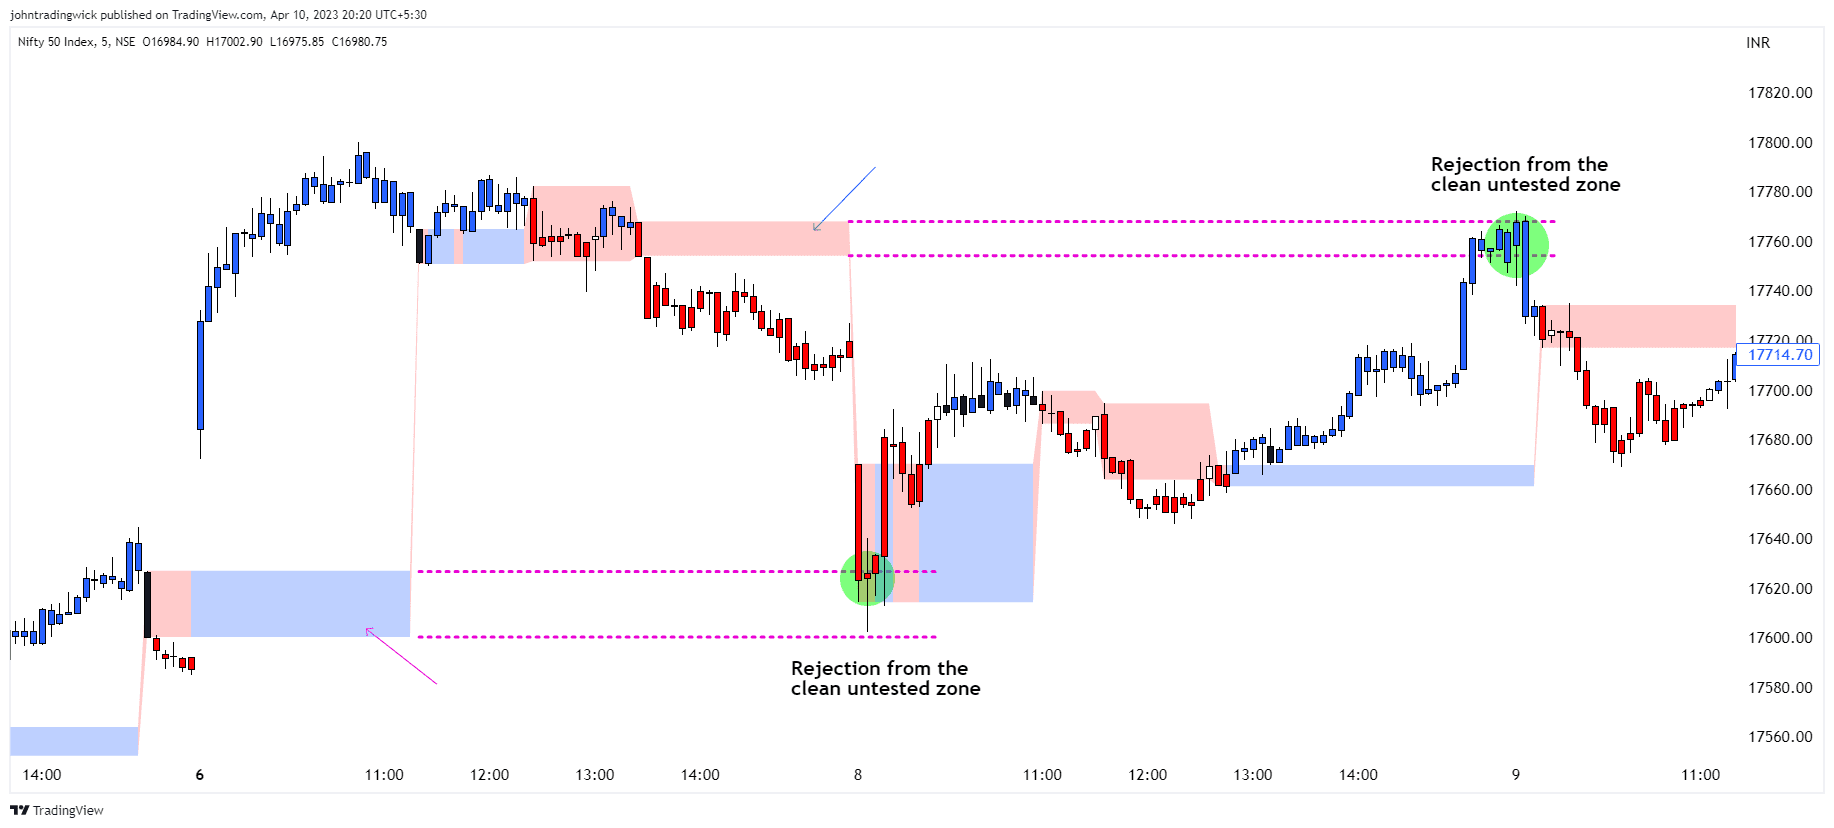
- Zones that remain clean and untested for several sessions are likely to act as strong support or resistance when the price revisits them.
Some Bullish Examples


Some Bearish Examples

Some examples of the Complete System


Trend Follower Framework Combined with Trendlines


How to Access the Free Trial?
To get started with your trial access, please click the button below and fill out the Google form.


