

Trading can be a daunting task, especially for beginners who may feel overwhelmed by the multitude of technical patterns and indicators. However, if you are a pattern trader then learning about some common patterns is essential for improving your performance. One such pattern that you should be familiar with is the “Bullish Flag Pattern.” This chart pattern is considered to be one of the most powerful tools in a trader’s arsenal, as it can help identify potential buying opportunities and maximize profits.
In this blog post, we will delve into the Bullish Flag Pattern, exploring its significance and how it works. We will also provide you with valuable tips on how to effectively use this pattern in your trading strategy. By the end of this post, you’ll have a solid understanding of the Bullish Flag Pattern and be ready to use it to your advantage in the market.
What is a Bullish flag pattern?
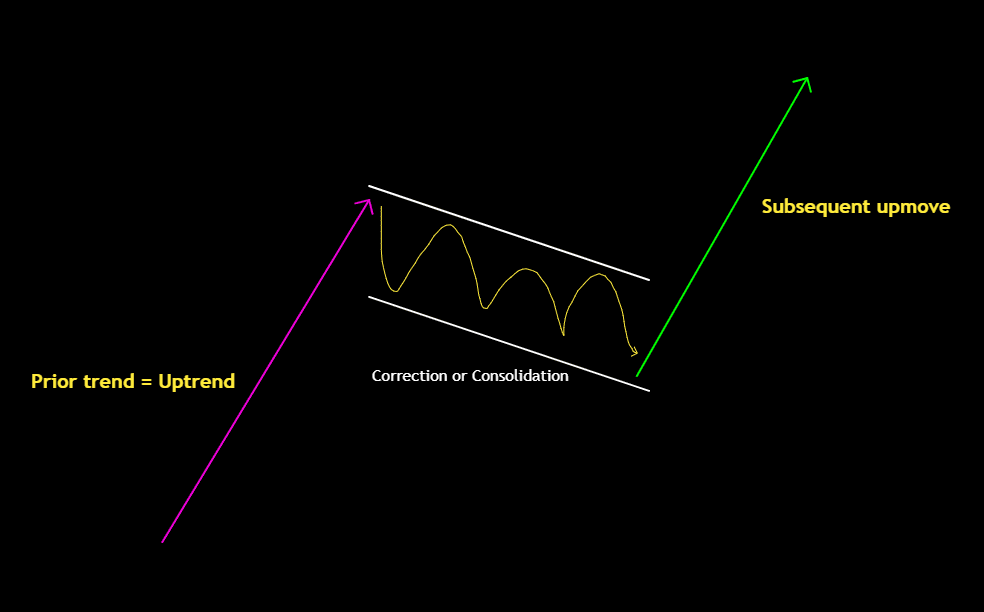
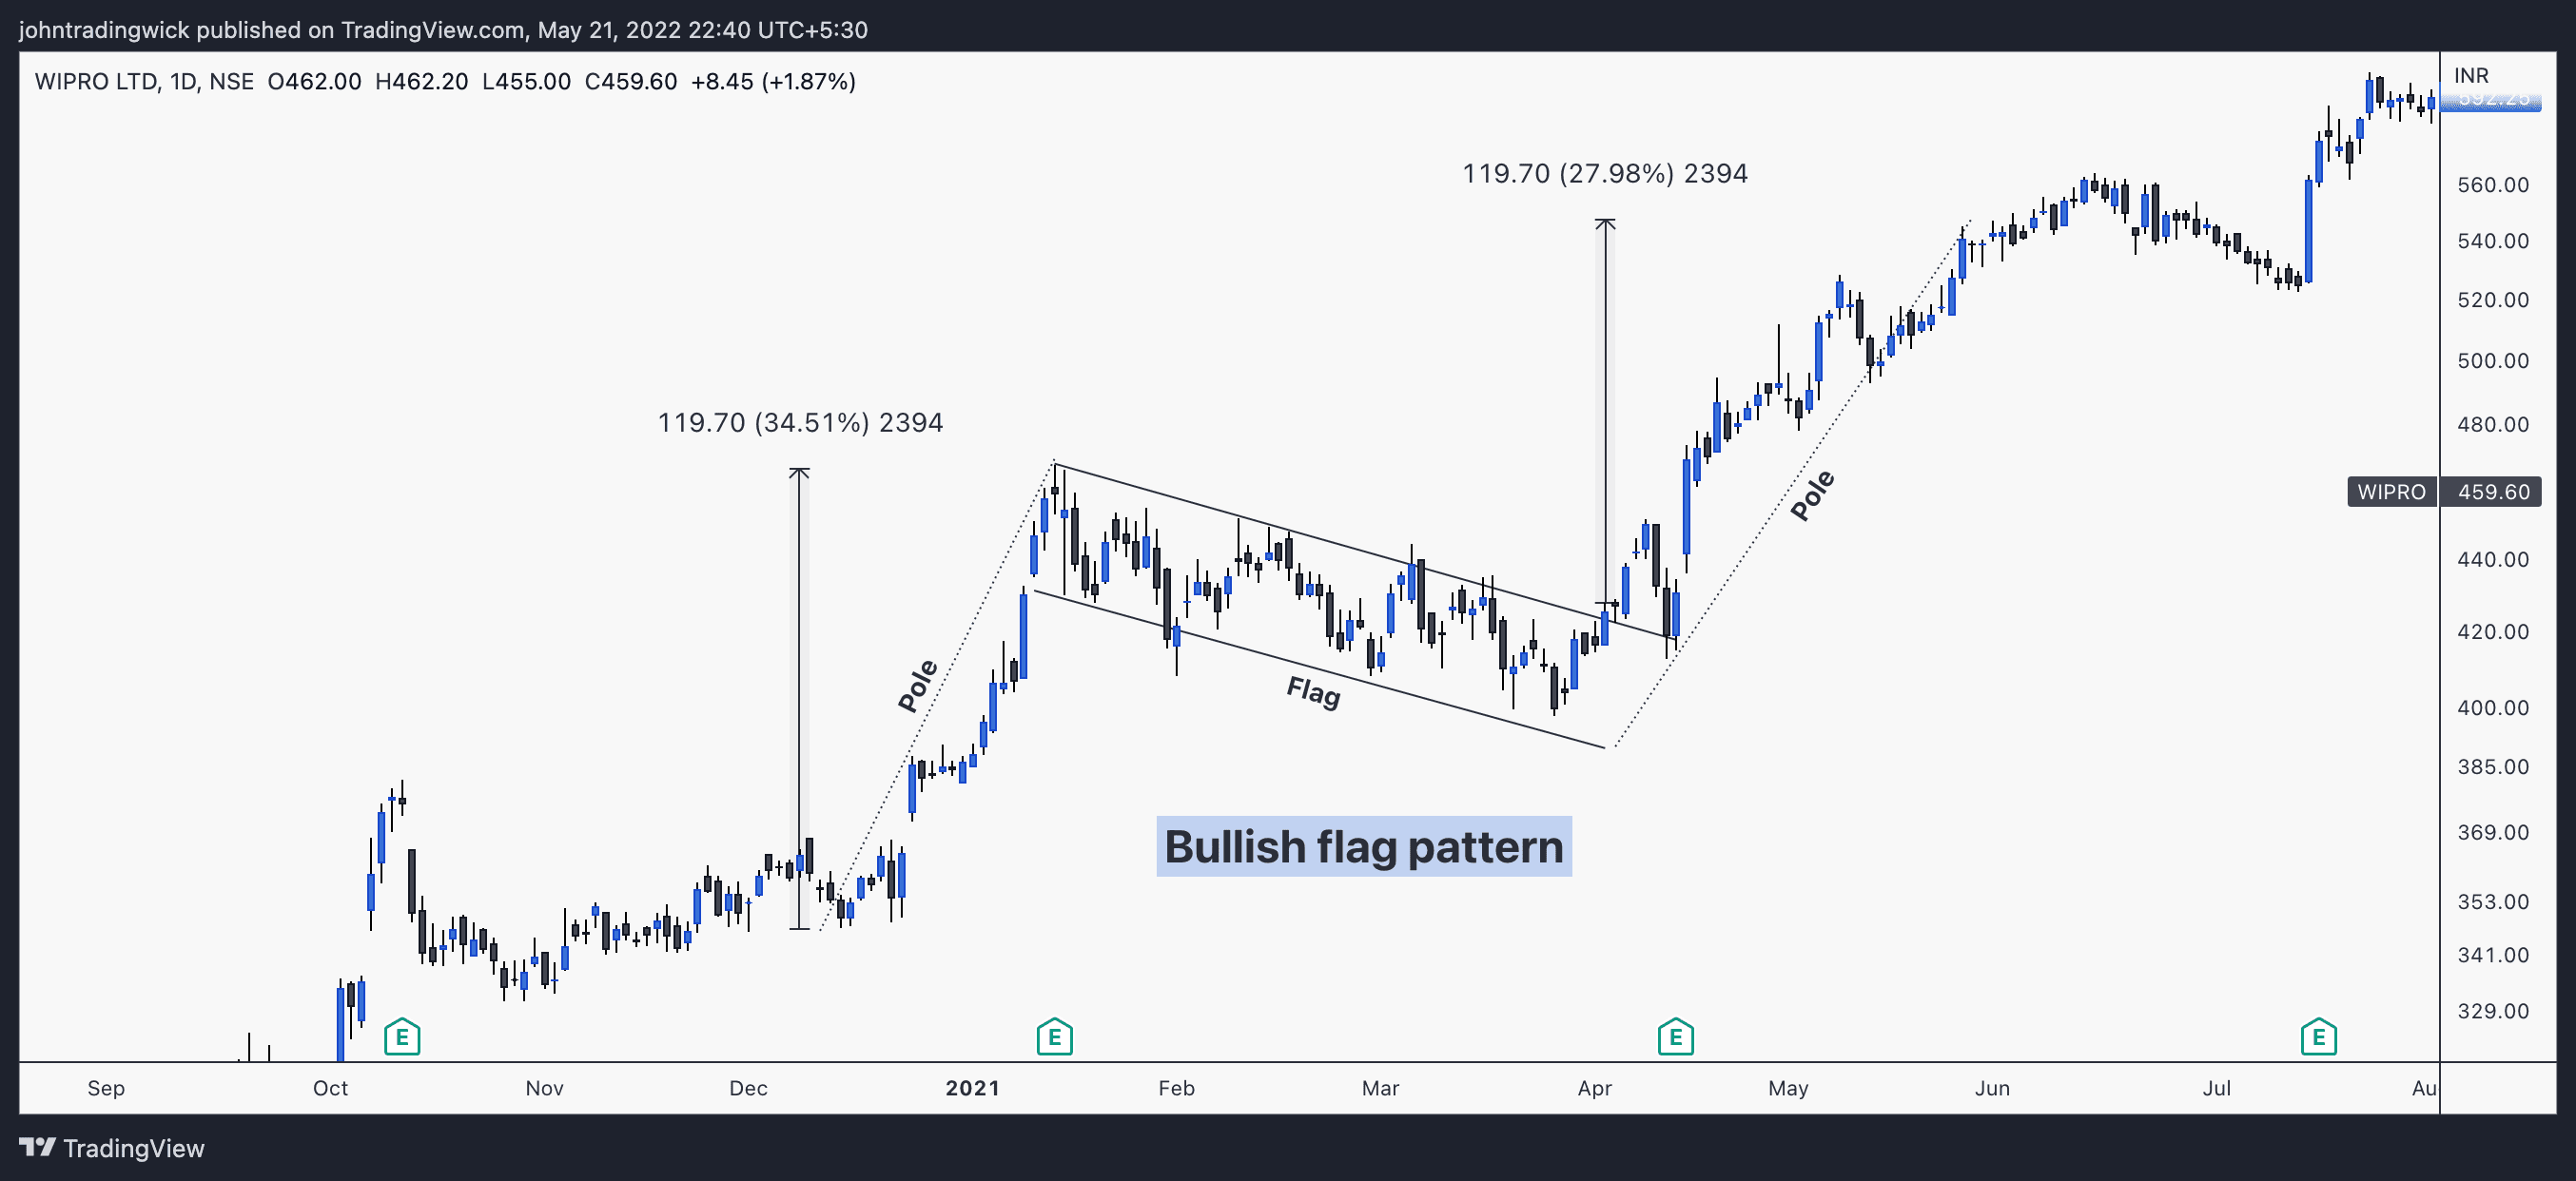
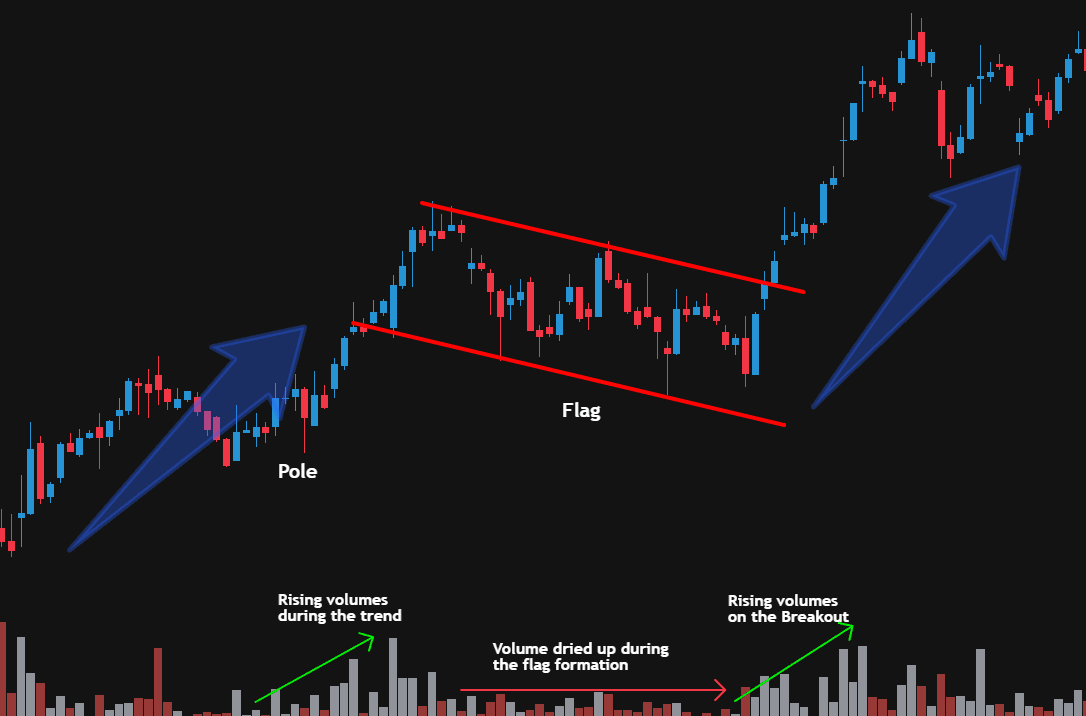
The Bullish Flag Pattern is a powerful technical chart pattern that can signal a potential continuation of an existing uptrend. This pattern typically forms when an asset experiences a sharp price increase, followed by a period of consolidation that resembles a flag and its pole, hence the name.
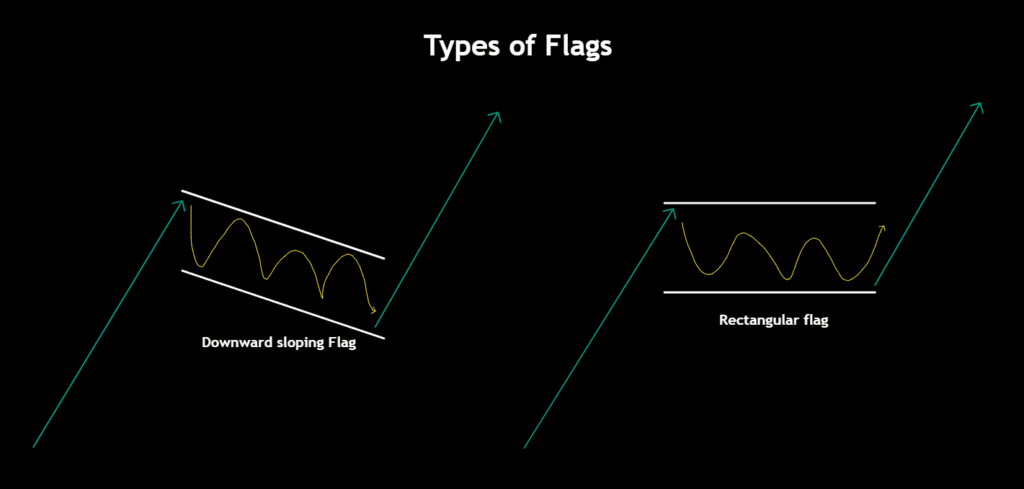
The flag portion of the pattern can take on different shapes, such as a horizontal rectangle or an angled formation that slopes downward away from the prevailing trend. Meanwhile, the pole section is characterized by a strong volume increase as buyers rush in, driving the price up rapidly. As the price enters the consolidation phase, volume typically decreases, reflecting a decrease in trading activity.
The Bullish Flag Pattern is widely viewed as a bullish signal, indicating that the price will likely continue to rise once the consolidation phase is over. By recognizing and correctly interpreting this pattern, traders can identify potential buying opportunities and take advantage of the upward momentum.
The Anatomy of a Bullish Flag Pattern:
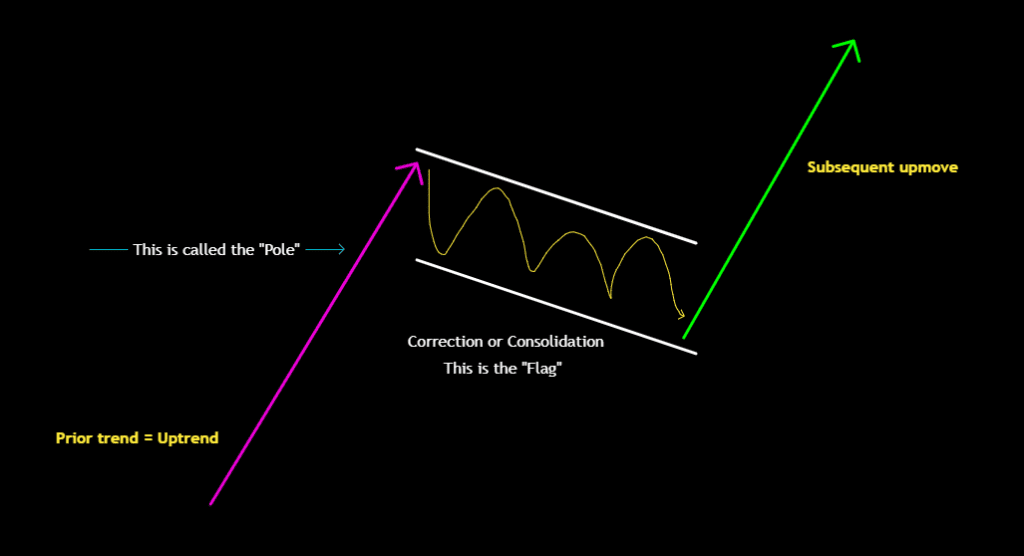
➡️ Pole
The flagpole is a critical component of the Bullish Flag Pattern, as it represents the initial steep uptrend that precedes the flag formation. During this phase, there is a strong buying momentum, with the price moving rapidly upward. This buying frenzy is driven by aggressive buyers who enter the market, creating a snowball effect that attracts even more buyers.
The length of the flagpole can vary, but it’s crucial to see a clear and significant price increase to confirm the pattern’s validity. Traders should look for a sharp and sudden price spike that reflects a significant change in market sentiment. The larger the flagpole, the stronger the bullish signal, as it indicates a more significant buying frenzy and a higher likelihood of continued price growth.
➡️ Flag
The flag is the second component of the Bullish Flag Pattern, and it represents the consolidation phase that occurs after the flagpole. As the buying frenzy subsides, the price eventually settles down, leading to a decrease in buying pressure. This can cause fewer and fewer buyers to enter the market, as the move seems overextended, and those who entered at the bottom start taking profits.
As a result, the stock enters into a consolidation phase, during which the price moves sideways or slightly downward within a parallel channel, creating a rectangular or slightly downward-sloping shape. The flag represents a period of indecision, as traders take profits, and new buyers enter the market, leading to a balance between buyers and sellers.
At the bottom of the consolidation range, new buyers may still enter the market, fearing that they might miss out on the move. This can create a support level that prevents the price from falling further. As the consolidation phase progresses, traders should look for a clear breakout from the channel to confirm the pattern’s validity.
➡️ Breakout
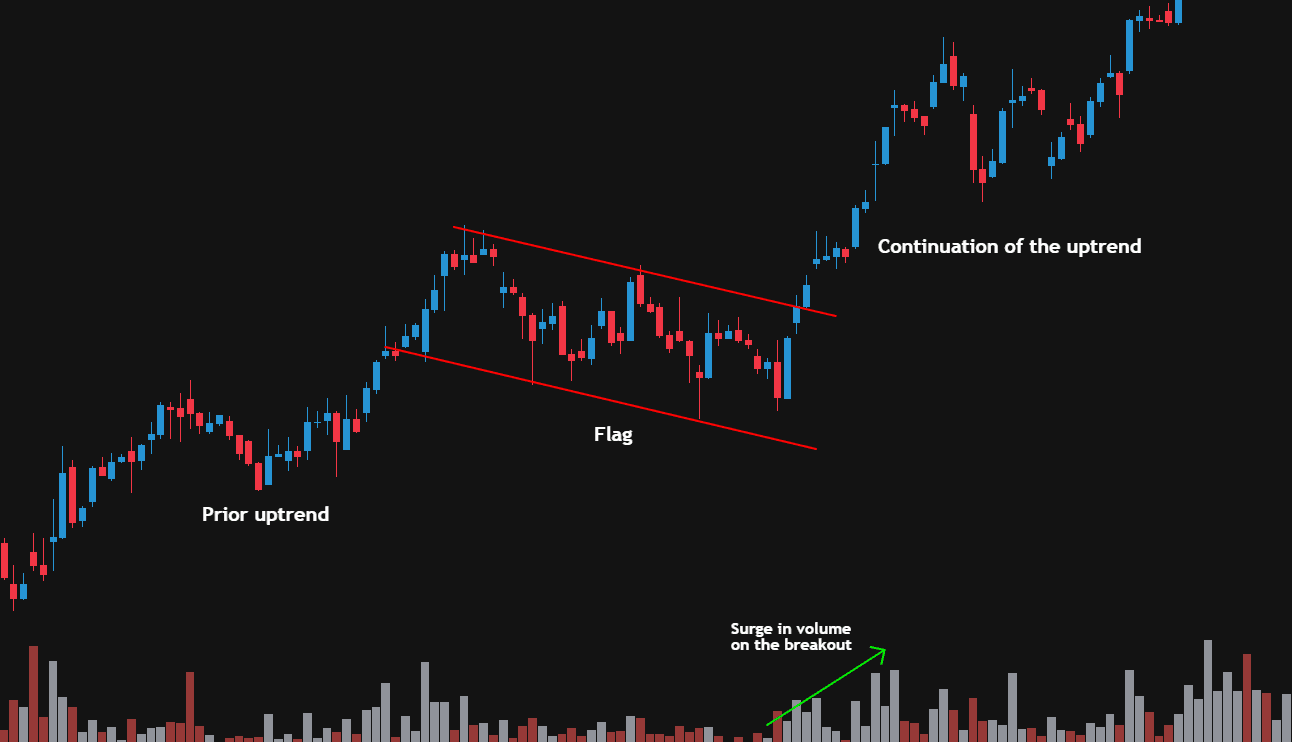
The breakout phase is the final and most crucial component of the Bullish Flag Pattern. It occurs when the price breaks out above the upper trendline of the flag formation, confirming the bullish continuation of the previous uptrend. This breakout is often viewed as a strong buying signal by traders, who use it as an entry point for a long position, expecting the price to continue its upward trajectory.
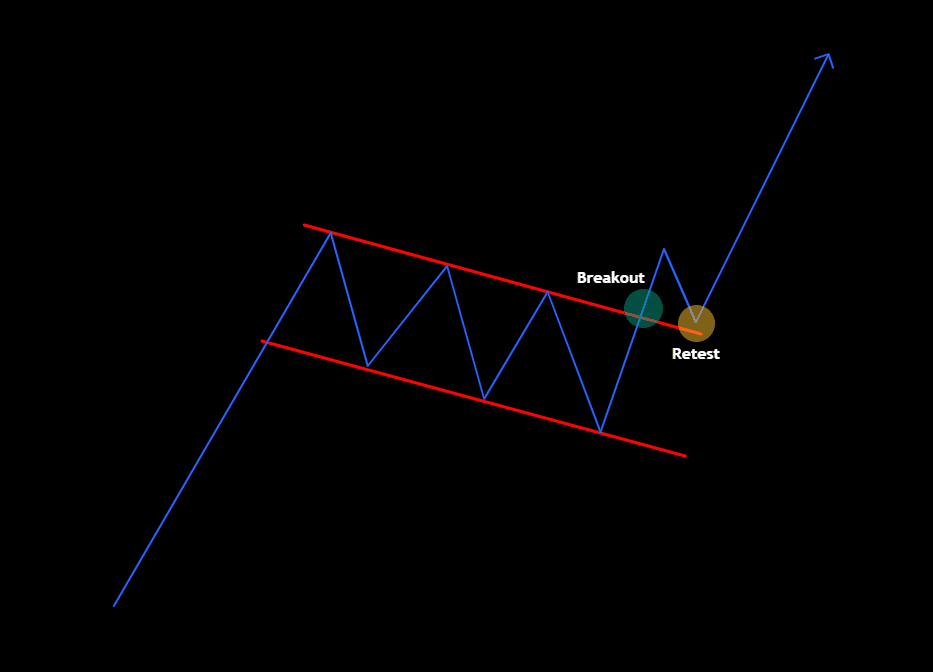
The breakout can happen in different ways. For instance, the price may break out suddenly, accompanied by a surge in volume, or it may gradually move up, testing the upper trendline several times before finally breaking through.
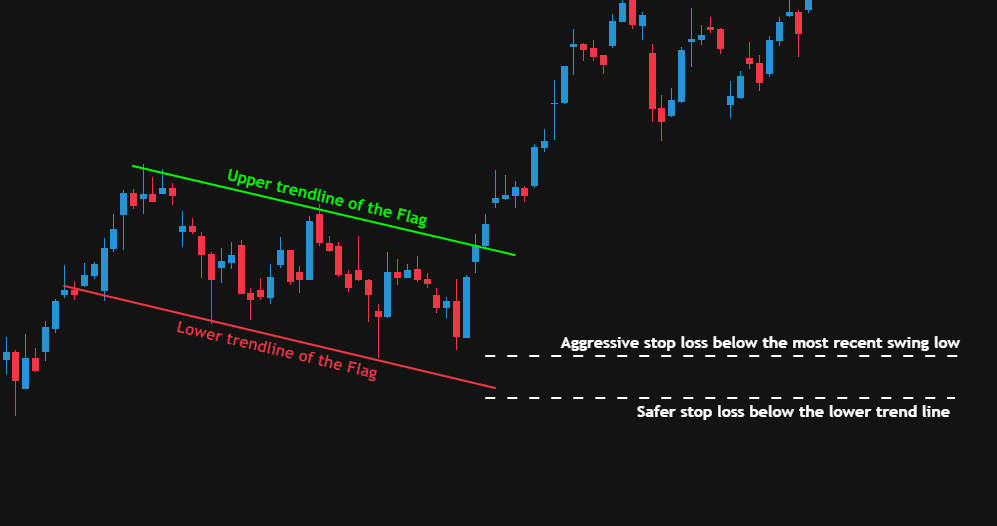
Once the breakout is confirmed, traders can set their stop-loss orders below the lower trendline of the flag formation or the most recent swing low, providing a buffer against potential losses if the price reverses. They can also set their profit targets based on the size of the flagpole, anticipating that the price will move at least as much as the length of the pole.
How to identify a bullish flag?
Identifying a Bullish Flag Pattern requires a careful analysis of the price chart and an understanding of the pattern’s key characteristics. By breaking down the identification process into several steps, traders can spot the pattern more easily and recognize potential trading opportunities.
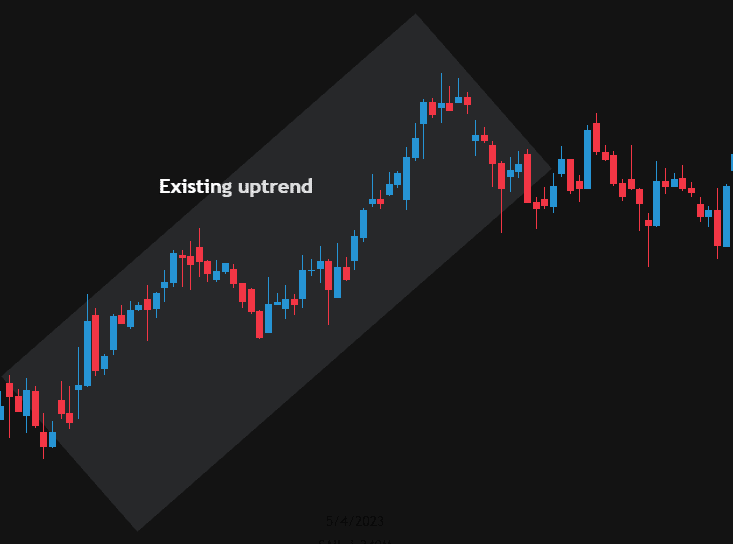
1. Identification of an existing uptrend
The first step in identifying a Bullish Flag Pattern is to recognize a strong uptrend in the price. Look for a sharp, sudden spike in price that reflects a significant change in market sentiment.
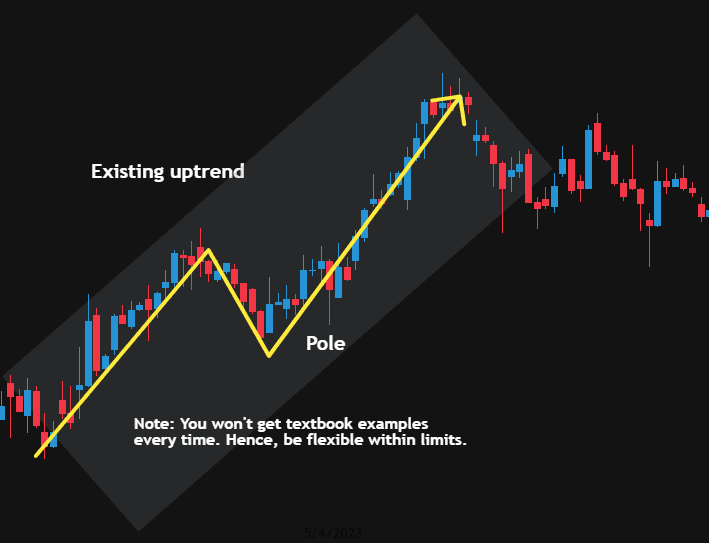
2. Look for the pole
After confirming the presence of an uptrend, search for a steep and rapid price increase, forming the flagpole. This should be a noticeable and sharp upward movement, reflecting a strong buying momentum.
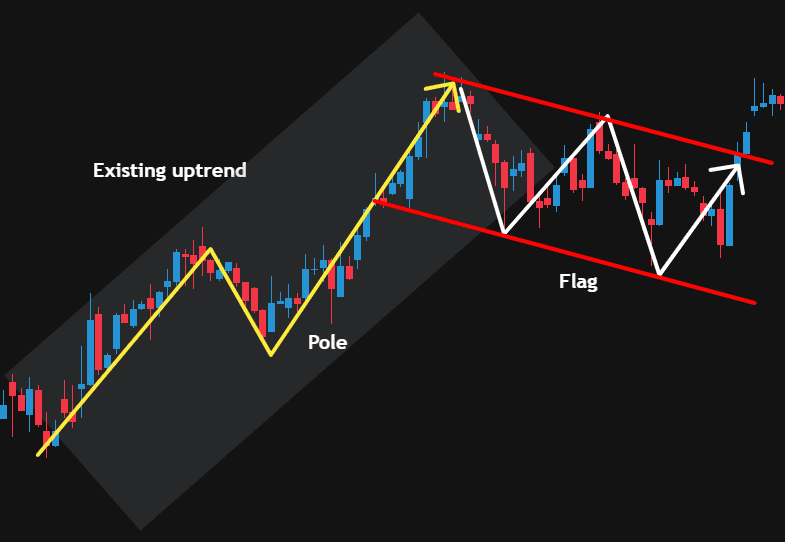
3. Identification of the flag
After the flagpole, the price will enter a consolidation phase, creating the flag. This phase should create a rectangular or slightly downward-sloping parallel channel. The flag can either be horizontal (flat consolidation) or a bit downward-sloping and is usually accompanied by a decrease in trading volume.
4. Track Volumes
The trading volume should decrease during the flag formation compared to the volume during the flagpole creation. This decrease in volume reflects the profit-taking and indecision in the market. When the breakout occurs, the volume should ideally increase, confirming the continuation of the bullish trend.
5. Wait for the breakout
The final step in identifying a Bullish Flag Pattern is to wait for the price to break above the upper trendline of the flag formation. Wait for clear confirmation of the breakout, ideally with a surge in volume and a strong upward price movement. This breakout signifies the continuation of the uptrend, providing a potential entry point for a long position.
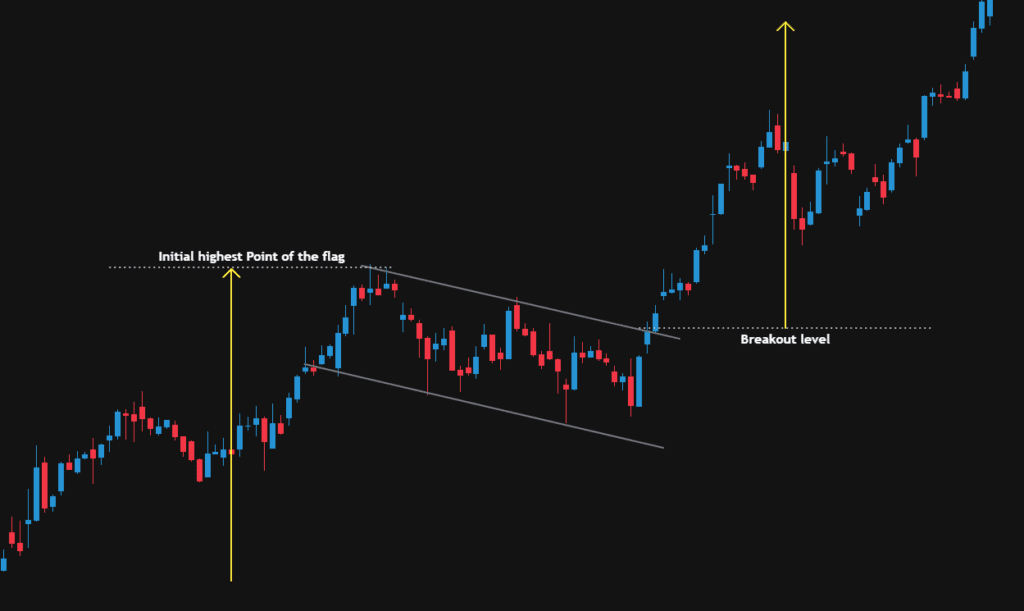
Target objective:
Employing the measurement objective technique, the price target is determined to be equivalent to the length of the pole. This can be calculated by measuring the vertical distance between the lowest point of the base and the highest point of the pole.
Stop-loss:
Ideally, a stop-loss order should be positioned below the lower trendline of the flag formation or the most recent swing low, providing a buffer against potential losses if the price reverses.
The Psychology Behind a Bullish flag pattern:
Strong uptrend and flagpole
The initial uptrend and the formation of the flagpole signal a period of strong bullish sentiment in the market, with buyers dominating and driving the price higher. This can create a sense of fear of missing out (FOMO) among potential buyers, who rush into the market to capitalize on the upward momentum. As more buyers enter, the buying frenzy intensifies, leading to a rapid price increase that forms the flagpole.
Consolidation and formation of the flag
After a sharp price increase, traders may begin to take profits, leading to a slowdown in buying momentum. Additionally, some potential buyers may be hesitant to enter the market at higher prices, waiting for a better entry point. As a result, the price enters a consolidation phase, forming the flag. During this phase, the price may move sideways or slightly downward within a parallel channel, reflecting a period of indecision and balance between buyers and sellers.
Once the stock enters the consolidation stage, short-sellers may regain some confidence and add to their ‘short’ positions, expecting the price to drop. However, this can cause them to get trapped once again when the price breaks out to the upside, leading to a short squeeze as they scramble to cover their positions.
Breakout and bullish continuation
Eventually, the buyers regain their confidence and overpower the sellers, causing the price to break above the upper trendline of the flag formation. Additionally, some short-sellers from the initial phases may still be trapped and can get squeezed once the price starts moving up.
FOMO and momentum
Once the breakout occurs, more traders and investors may enter the market, driven by the fear of missing out on potential gains. This new wave of buying pressure can fuel the price higher, reinforcing the bullish continuation. In addition, technical traders who have been waiting for the Bullish Flag Pattern confirmation may also enter long positions, adding to the momentum.
How reliable is a bull flag pattern?
Flag patterns are widely recognized as one of the most reliable continuation patterns used by traders, as they provide a setup for entering an existing trend that is poised to continue. These patterns tend to appear in similar situations within an existing trend and are highly consistent in their formation.
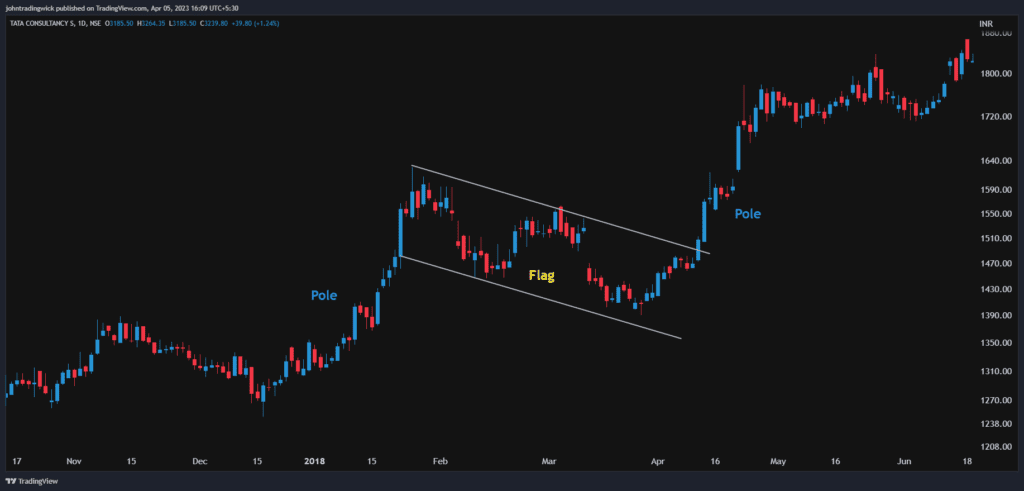
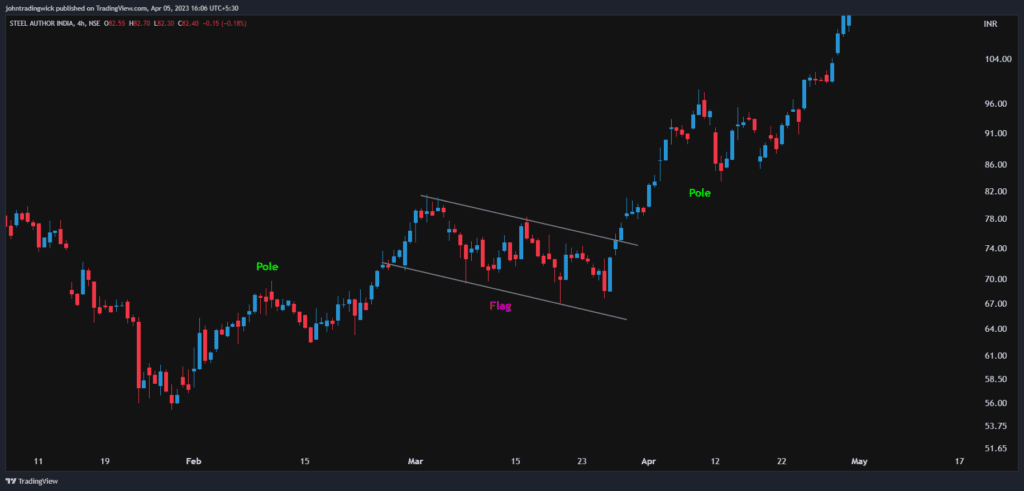
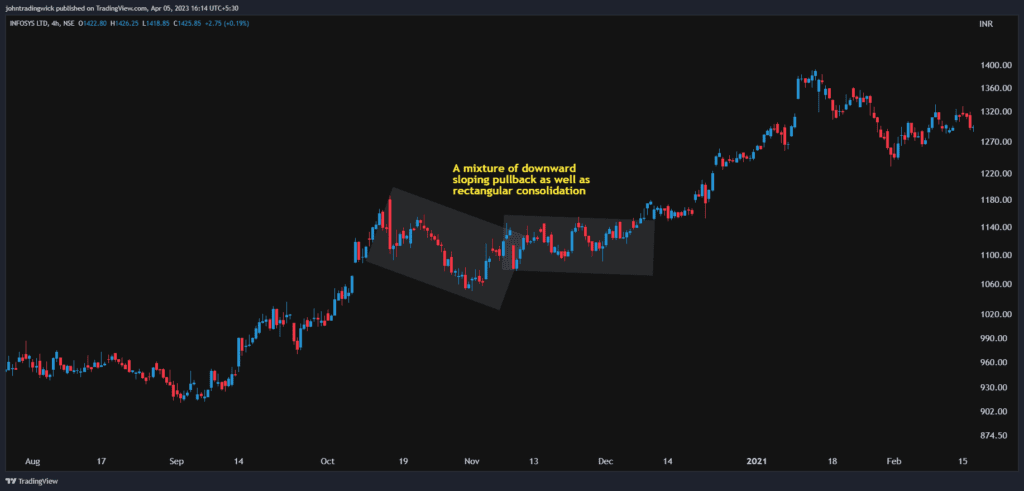
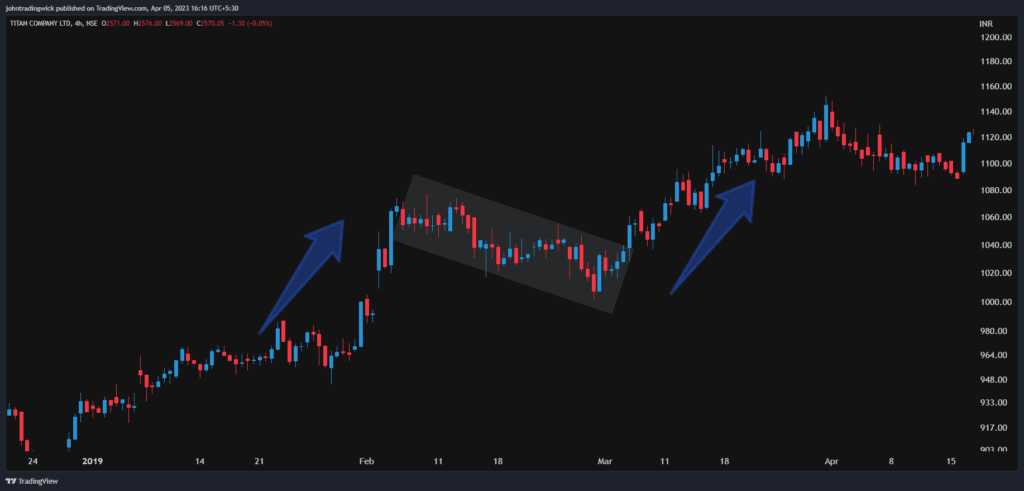
Exhibits:

Thanks for reading. Hope this was helpful!
If you liked this article, then don’t forget to share it! Follow me on Twitter and YouTube for more educational content.


