


I have attempted to present a comprehensive overview of the Nifty index’s market cycles spanning from 2001 to 2021 in this post. Whether or not this post is coherent, I encourage you to read it with an open mind, free of any preconceptions.
Nifty Index from 2001-2021: Important pointers
In this discussion, we will delve into the following aspects:
- Corrections observed after each cycle
- Price movement in relation to RSI (Relative Strength Index)
- Three major crashes between 2001 and 2021
- Market structure analysis
- Date and price range of each cycle
- Mean value of RSI
- Identification of candlestick patterns preceding a reversal
- Nifty index performance compared to the US Dollar Index (DXY)
- Present market scenario.
Nifty Index from 2001-2021: Corrections after each cycle
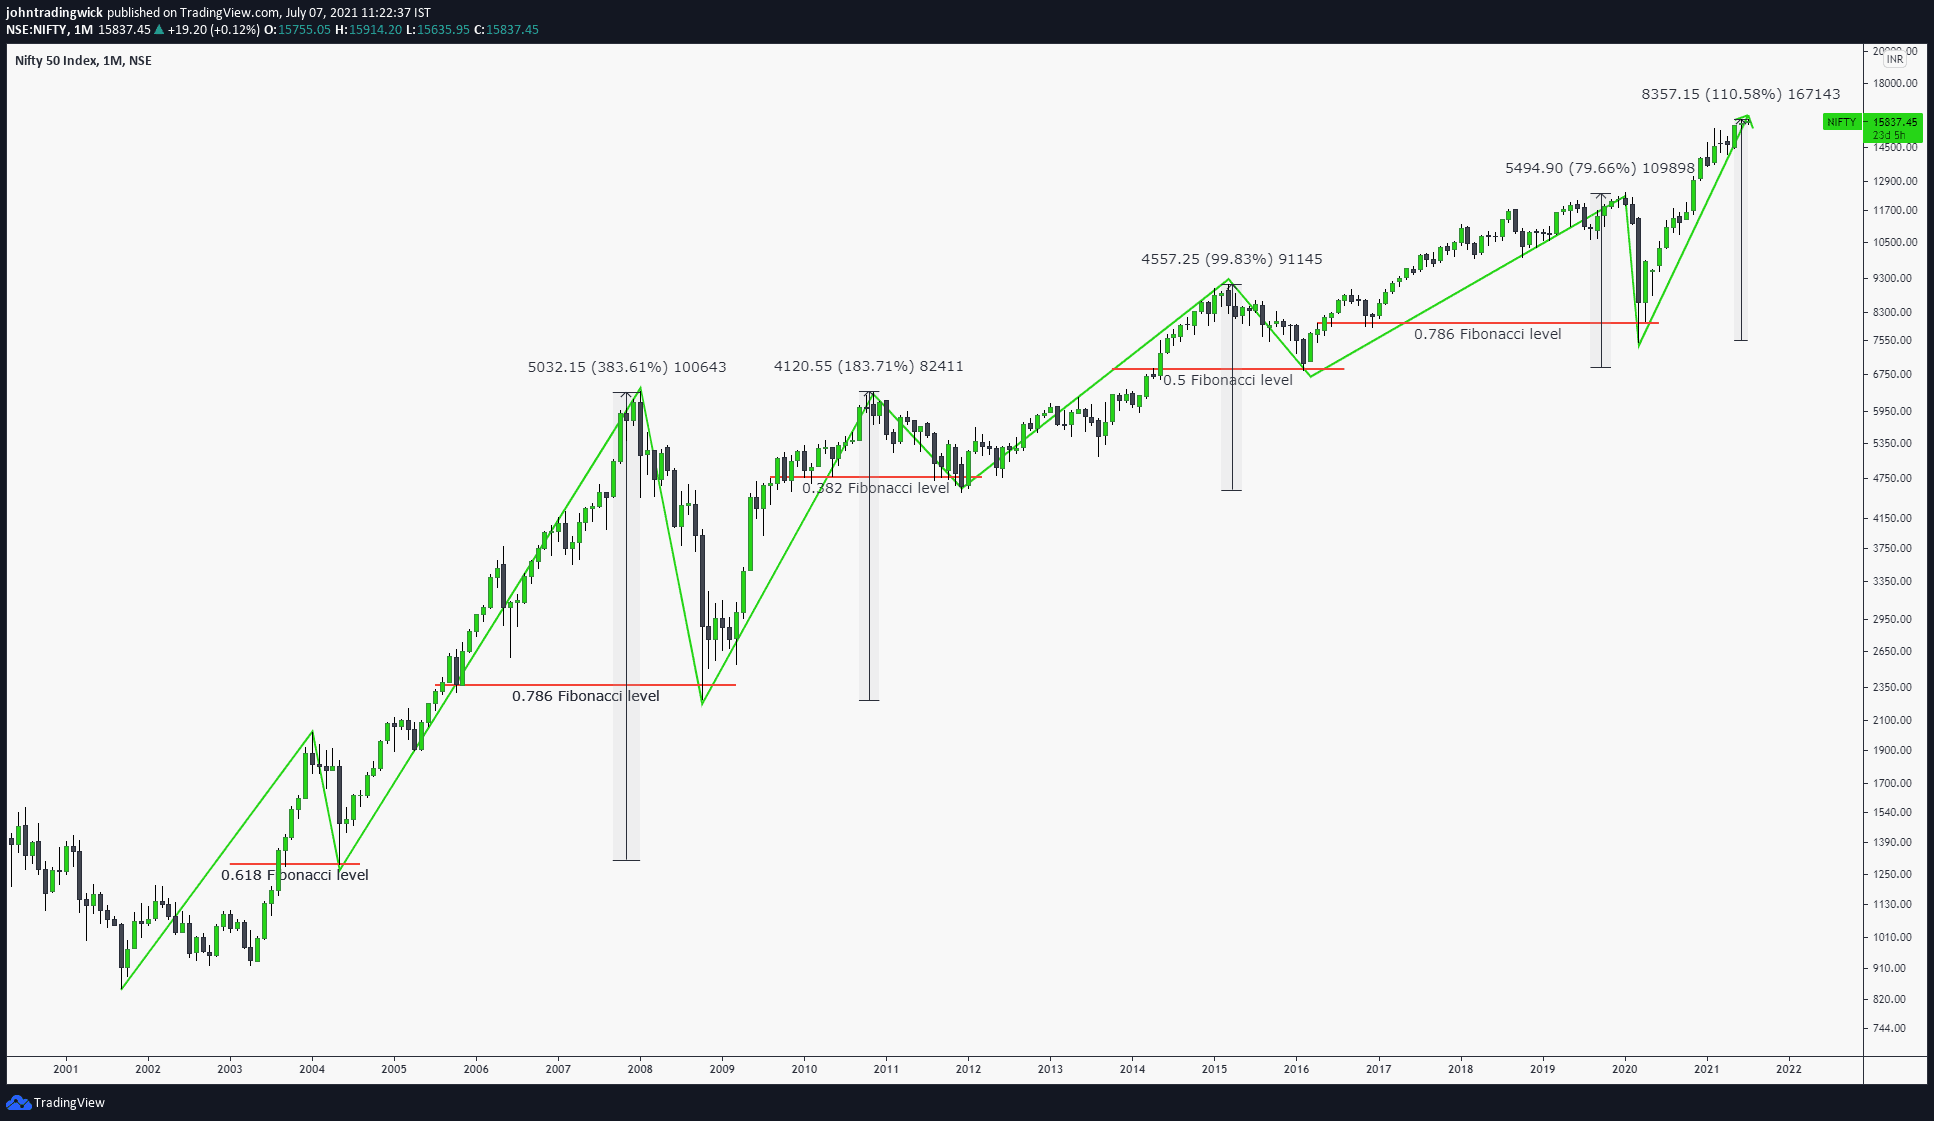
Following every bull run, the market has undergone corrections ranging from 0.382 to 0.786 Fibonacci levels. Typically, the corrections have been shallow, within 0.382 to 0.5 Fib levels. However, in exceptional cases, external factors caused corrections to reach 0.618 to 0.786 levels. At the conclusion of each bear run, the market has experienced average returns of 167% from the bear run’s low to the bull run’s high. In the current cycle, the rally has amounted to approximately 110%.
Price movement in relation to RSI (Relative Strength Index)
A glance at the relative strength index (RSI) levels of each cycle between 2001-2021 reveals that the highest RSI at the peak was approximately 85, while the lowest was 66. Presently, the RSI of the current cycle stands at 74.

Three major crashes between 2001 and 2021
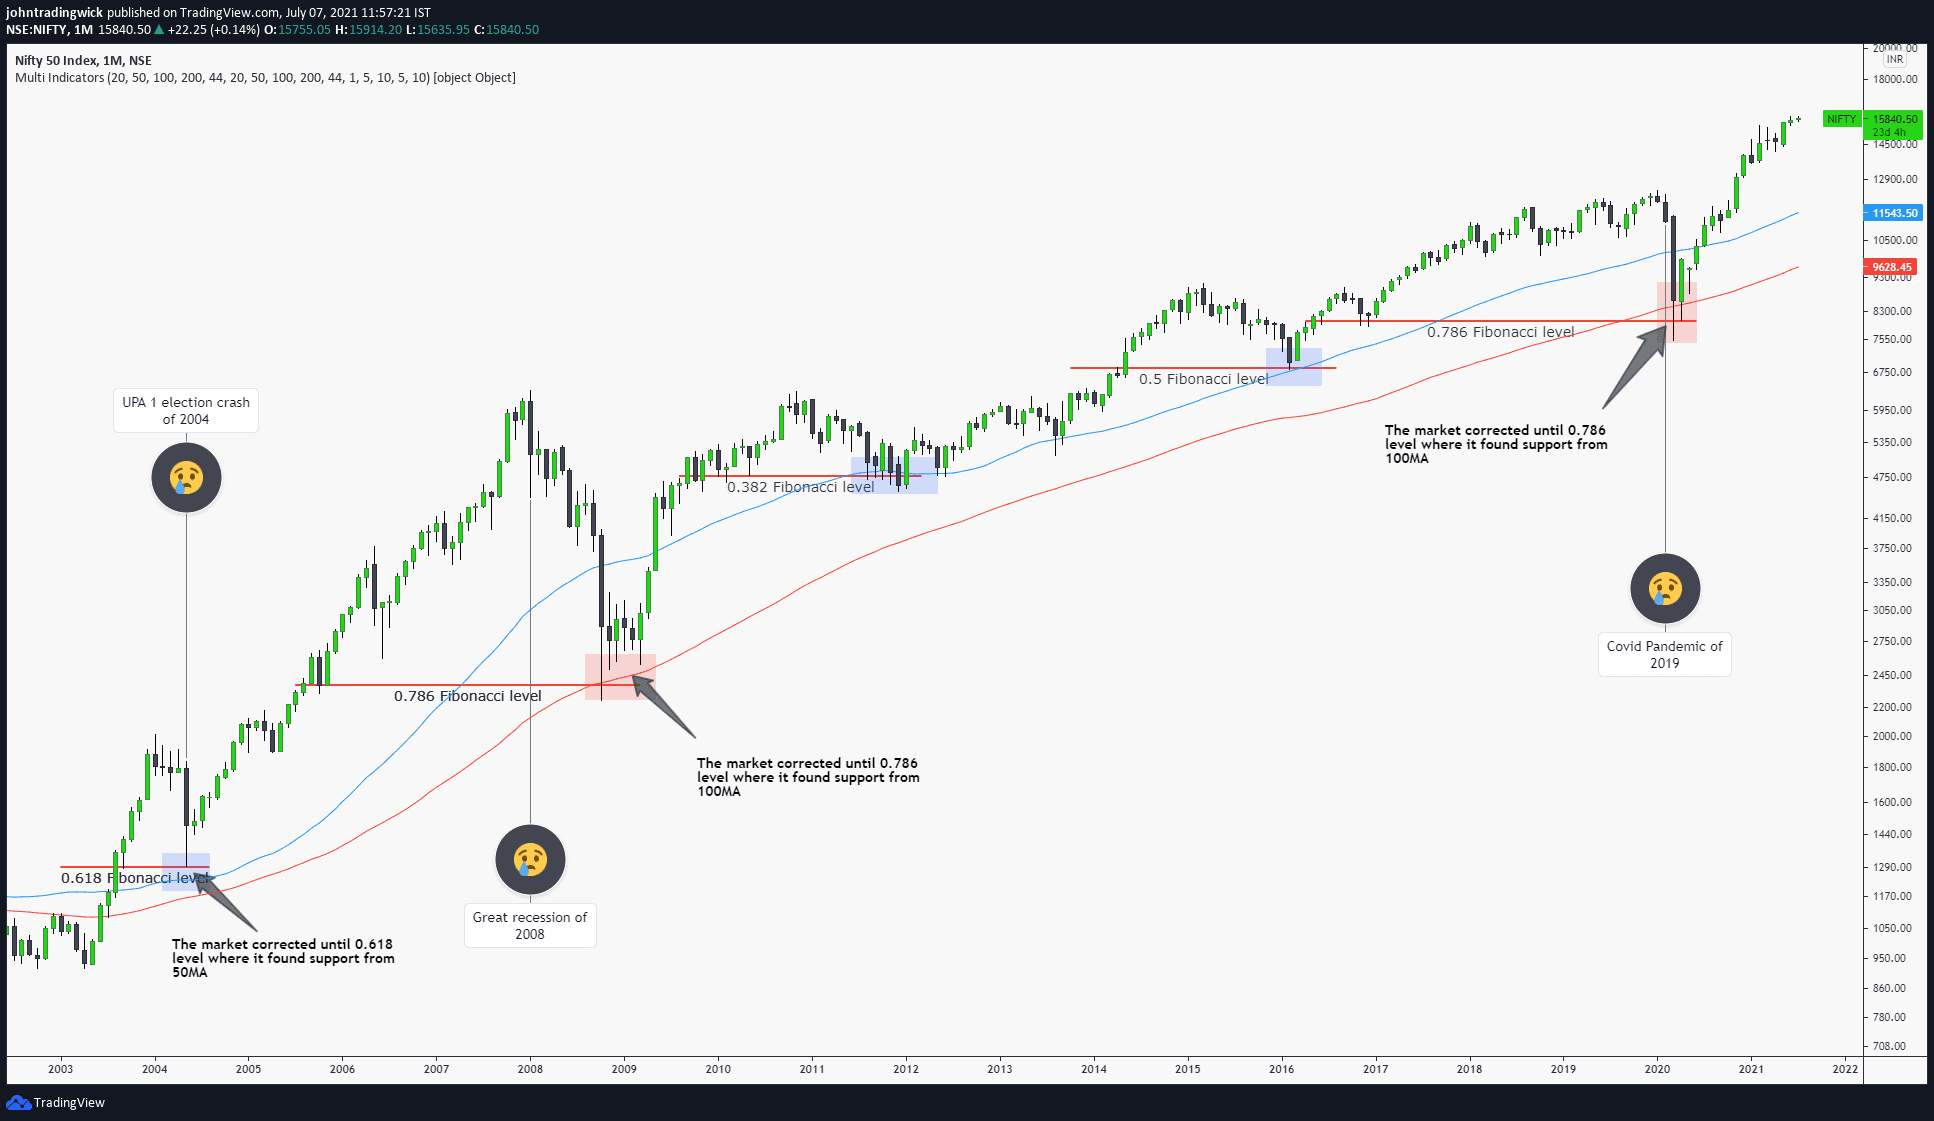
UPA 1 election crash of 2004
The market experienced an abrupt decline, correcting until the 0.618 Fibonacci level, where it found support from the 50 simple moving average.
The Great Recession of 2008
Global markets faced significant selling pressure due to the US housing industry collapse. Nifty plunged to around 2k, which coincided with the 0.786 Fibonacci level, and this level found support from the 100MA.
The Covid Pandemic of 2019
The market witnessed a sharp decline, dropping from 12k to 7k within two months. This level also marked the confluence zone of the 0.786 Fibonacci level and 100MA. As I mentioned earlier, the market undergoes deeper corrections to the 0.618 and 0.786 Fibonacci levels only under external driving forces. In all other cases, the market only drops to 0.382 or 0.5 Fibonacci level.
Nifty Index from 2001-2021: Market structure analysis
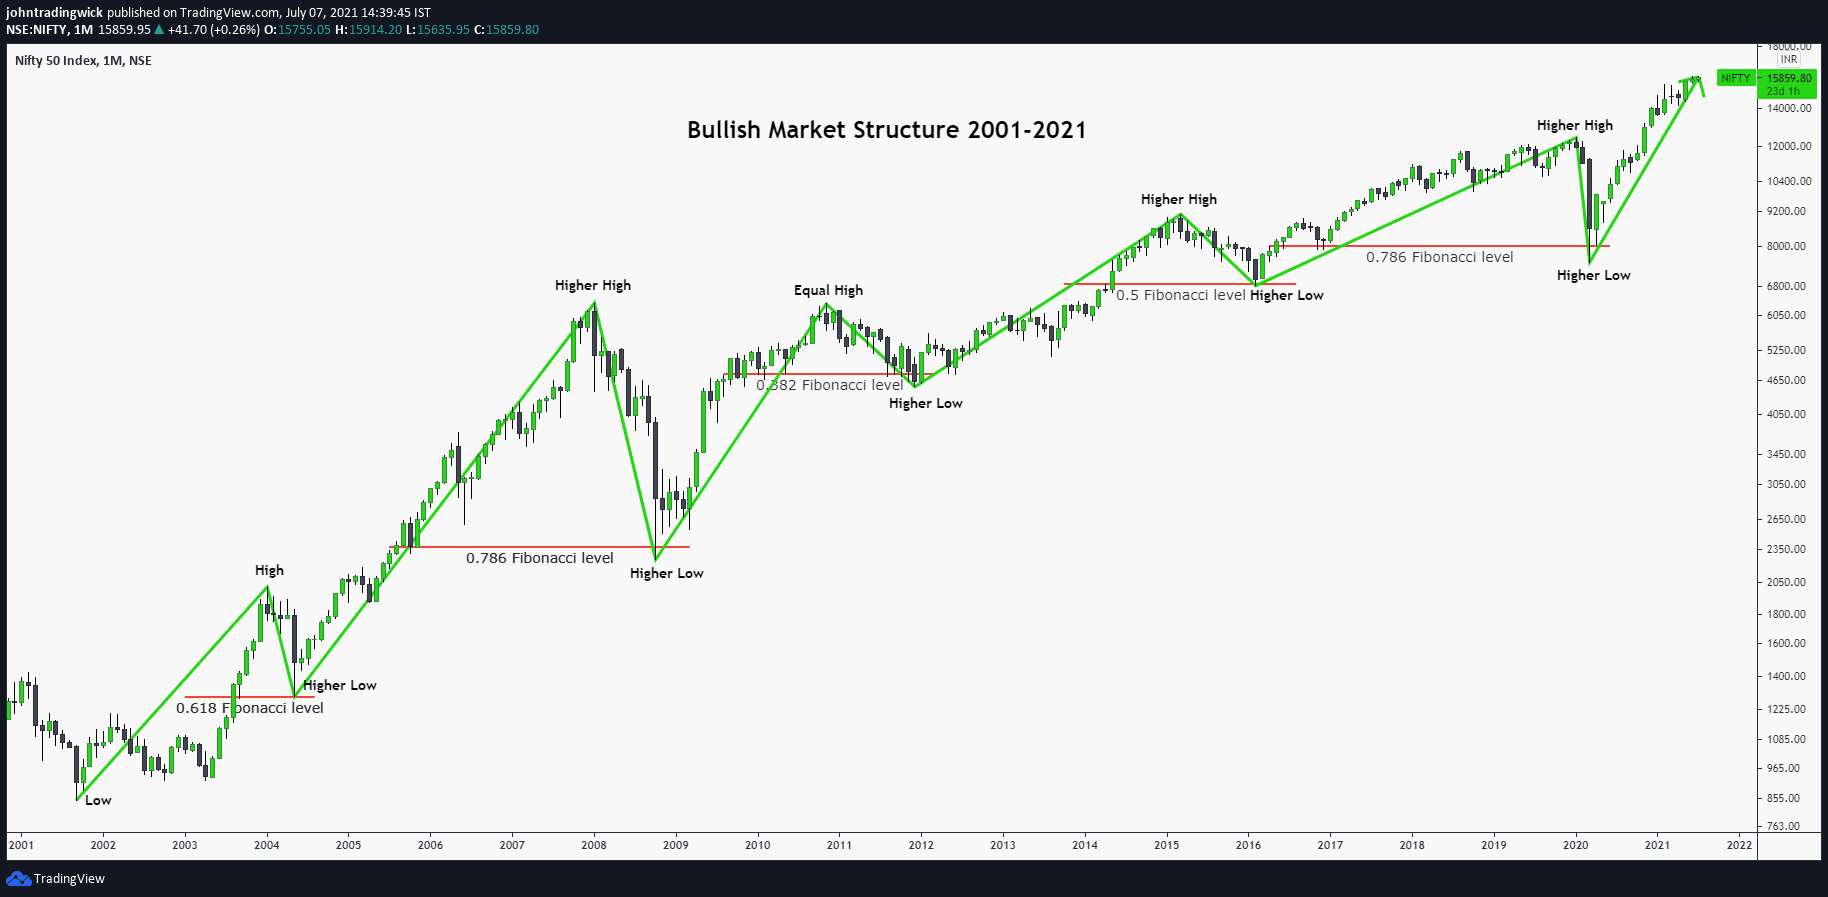
Since 2001, the market has been consistently bullish on the monthly time frame, with the price forming a continuous series of higher highs and higher lows.
Nifty Index from 2001-2021: Date and Price range of each cycle

From the low of the Bear cycle to the peak of the next Bull cycle, the market rallied about an average of 167%. In the current cycle, we have already rallied to about 110%. On average, it took approximately 1008 days for each swing to form. On this note, the present swing is the shortest swing till now and took about 486 days for the formation.
Who knows, what might we see next? The cycle from 2004-2008 lasted about 1338 days and gave about 392% gain and only had a few shallow corrections on lower time frames.
Mean value of RSI
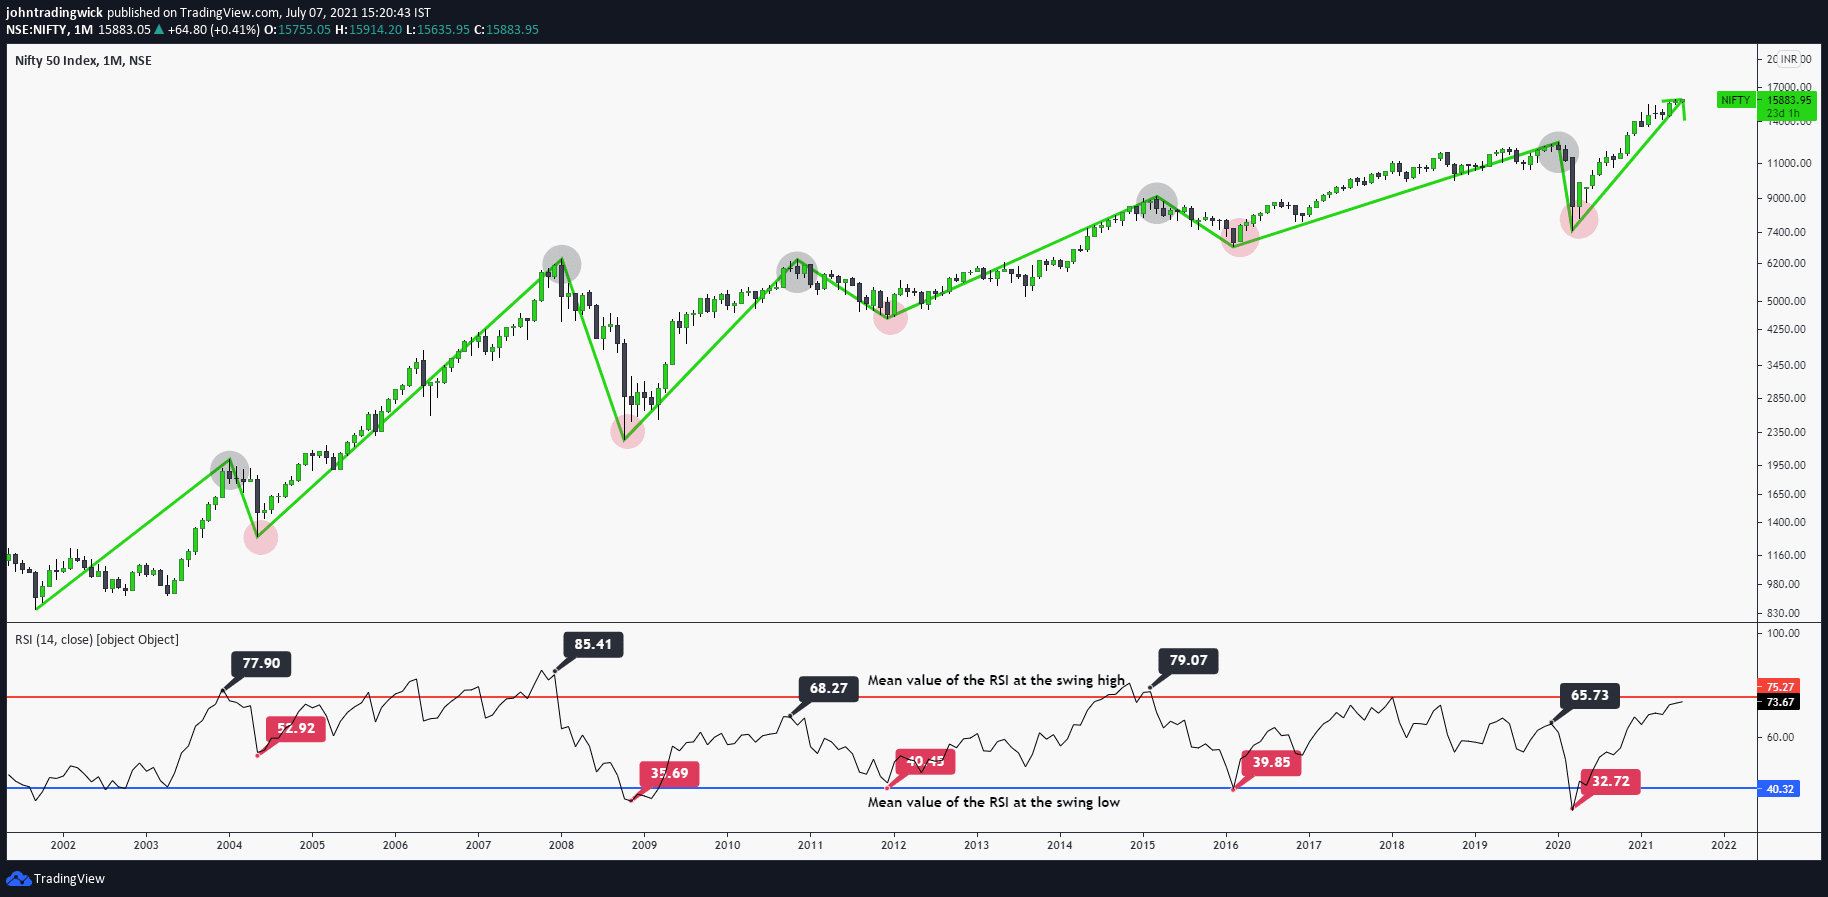
We can see that the maximum RSI at the peak was around 85 and the minimum RSI at the peak was 66. If we calculate the simple mean values of the 5 swings from 2001-2011, we get the mean value of the RSI at the swing high as 75 and the mean value of the RSI at the swing low as 40. Currently, we are already standing at 73.
Candlestick patterns formed before the reversal
While various reversal patterns exist, and any of them can emerge at any moment, we have witnessed only a few patterns recurring in the case of Nifty. These patterns include Hammers, Dojis, and Bearish Engulfing. If you wish to refer to these patterns more specifically, you may identify them as Shooting Stars, Hanging Man, and Spinning Top, among others.
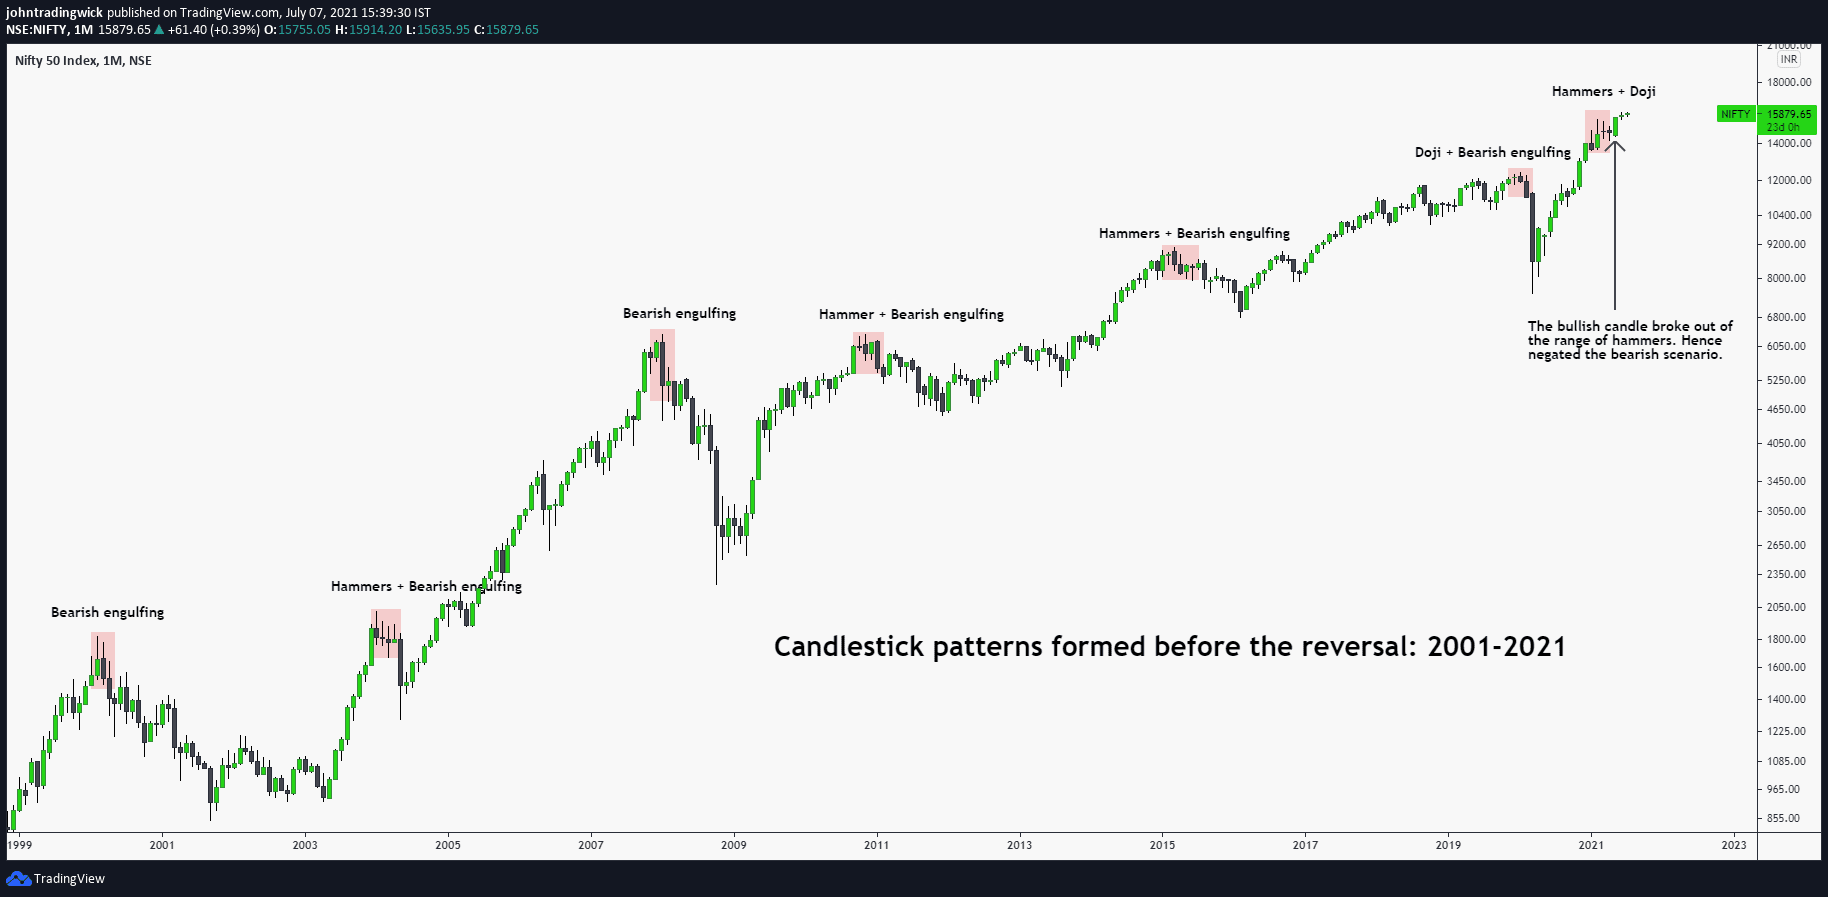
In the current cycle, we saw a series of hammers from January to April. But in May, a good Bullish candle was formed which broke out of the range of hammers. This invalidated the bearish bias. A small doji was again formed in June. Hence, we will have to observe in the coming months as to what type of candlesticks gets formed. This may help us in assessing the future direction of the market.
Nifty index performance compared to the US Dollar Index (DXY)

Nifty and DXY typically demonstrate a negative correlation, and at times, an inverse relationship. A negative correlation denotes a connection between two variables where an increase in one variable corresponds with a decrease in the other, and vice versa.
When the Nifty rises, DXY falls and when the DXY rises, the Nifty falls. For a brief time period, we can also a positive correlation between the two when they both moved in tandem. Currently, we observe an inverse correlation between Nifty and DXY, as Nifty stands at a high while DXY is at a low.
Current scenario:

Finally, it is worth noting that the current price is currently at the 1.618 Fibonacci extension level of the previous swing. A successful breakthrough of this level with strong follow-through may lead to the 18000 level in the near future. However, in the event of a decline from this point, we may see a drop towards 14500, followed by 12500 as the ultimate target.