


Understanding market structure is crucial for successful trading, yet it’s often overlooked. Many traders don’t invest enough time and effort into learning about market structure, which can be a costly mistake. In this post, I’ll dive into the key aspects of market structure, using clear illustrations and real-world examples to help you understand this important topic.
What is Market tructure?
- Market structure is a framework for comprehending the movements and behaviour of markets.
- In layman’s terms, it is a basic form of understanding how markets move.
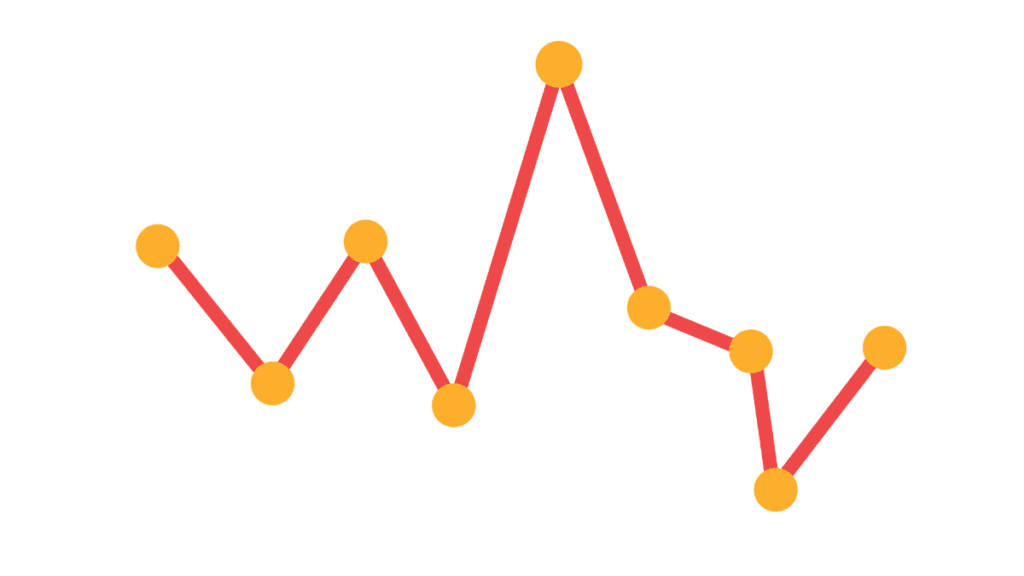
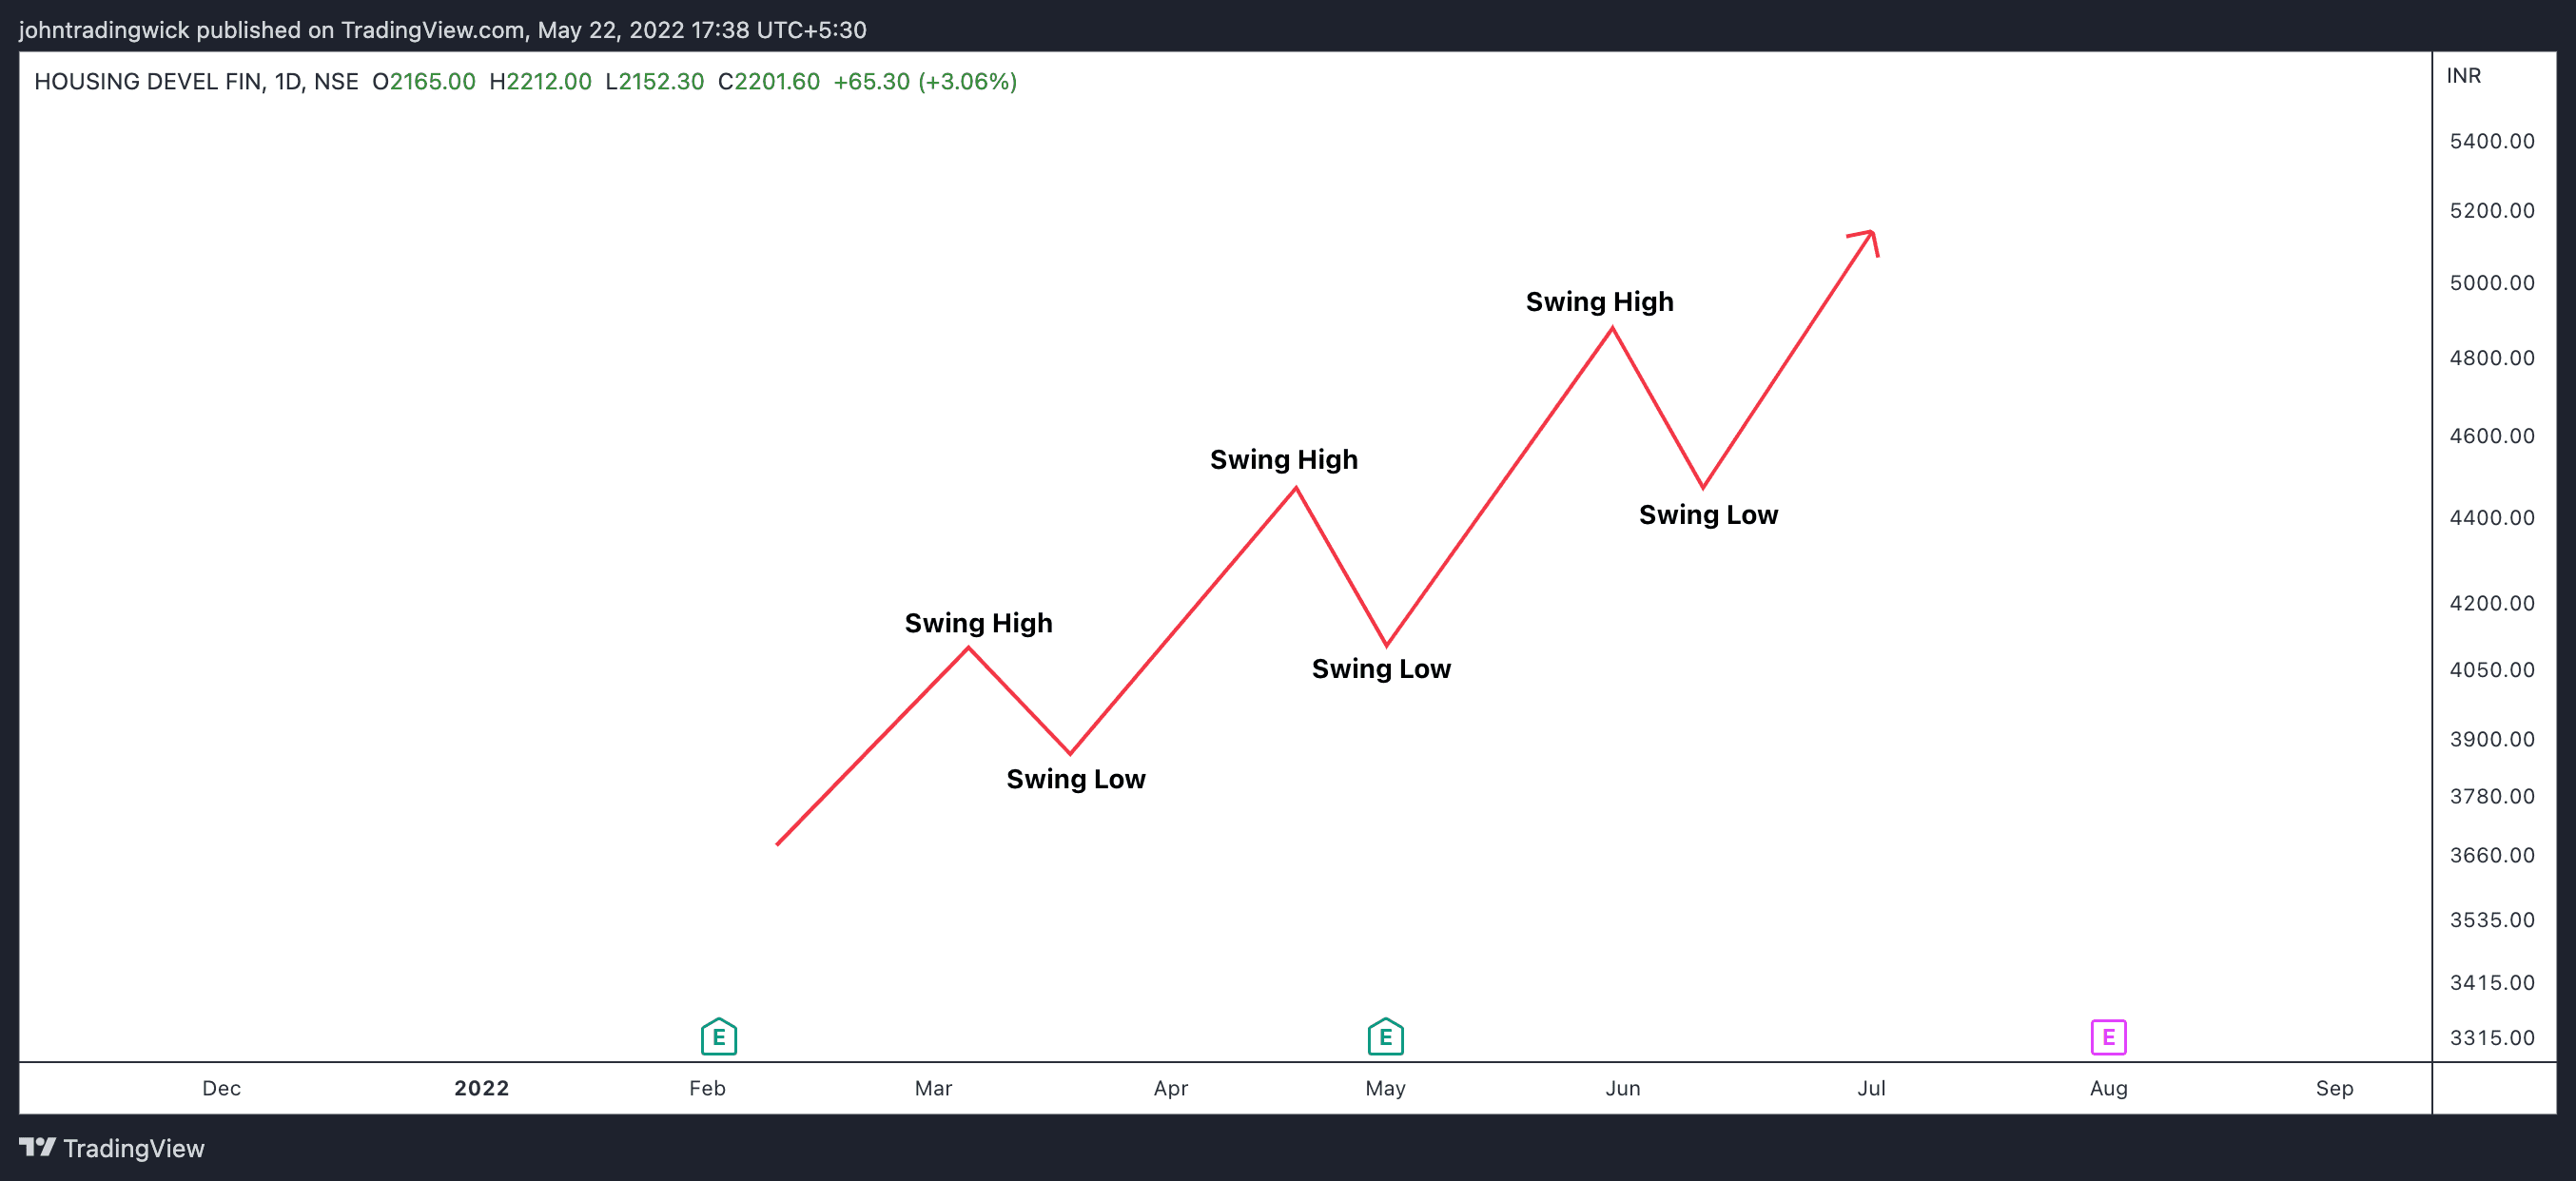
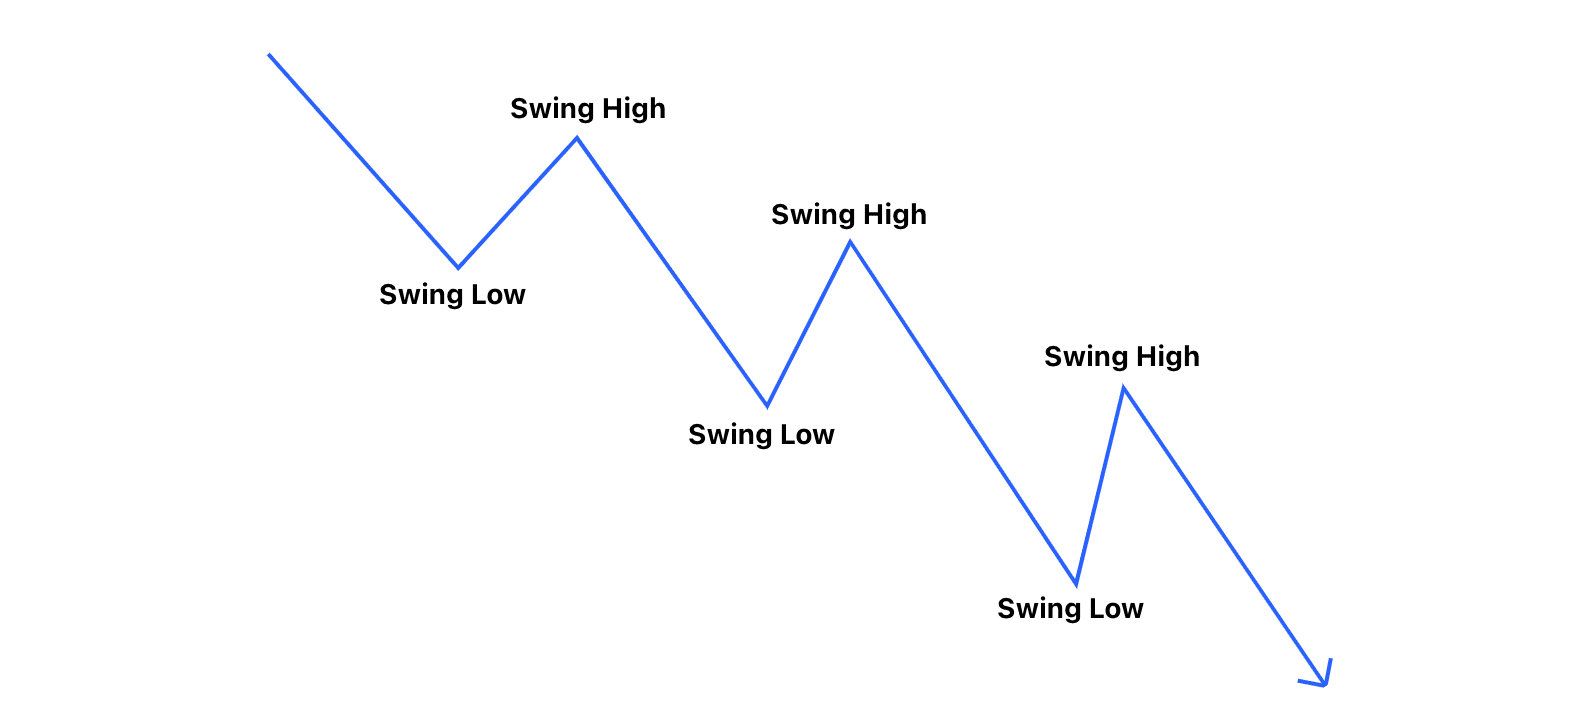
- It can be seen as the flow of the price between a series of swing highs and swing lows.
- The market moves in trends, which are the result of various patterns and structures that form and evolve over time.
- The price action is how the market moves based just on price, without the consideration of trends and how they may continue. But the market structure is focused mainly on the trend.
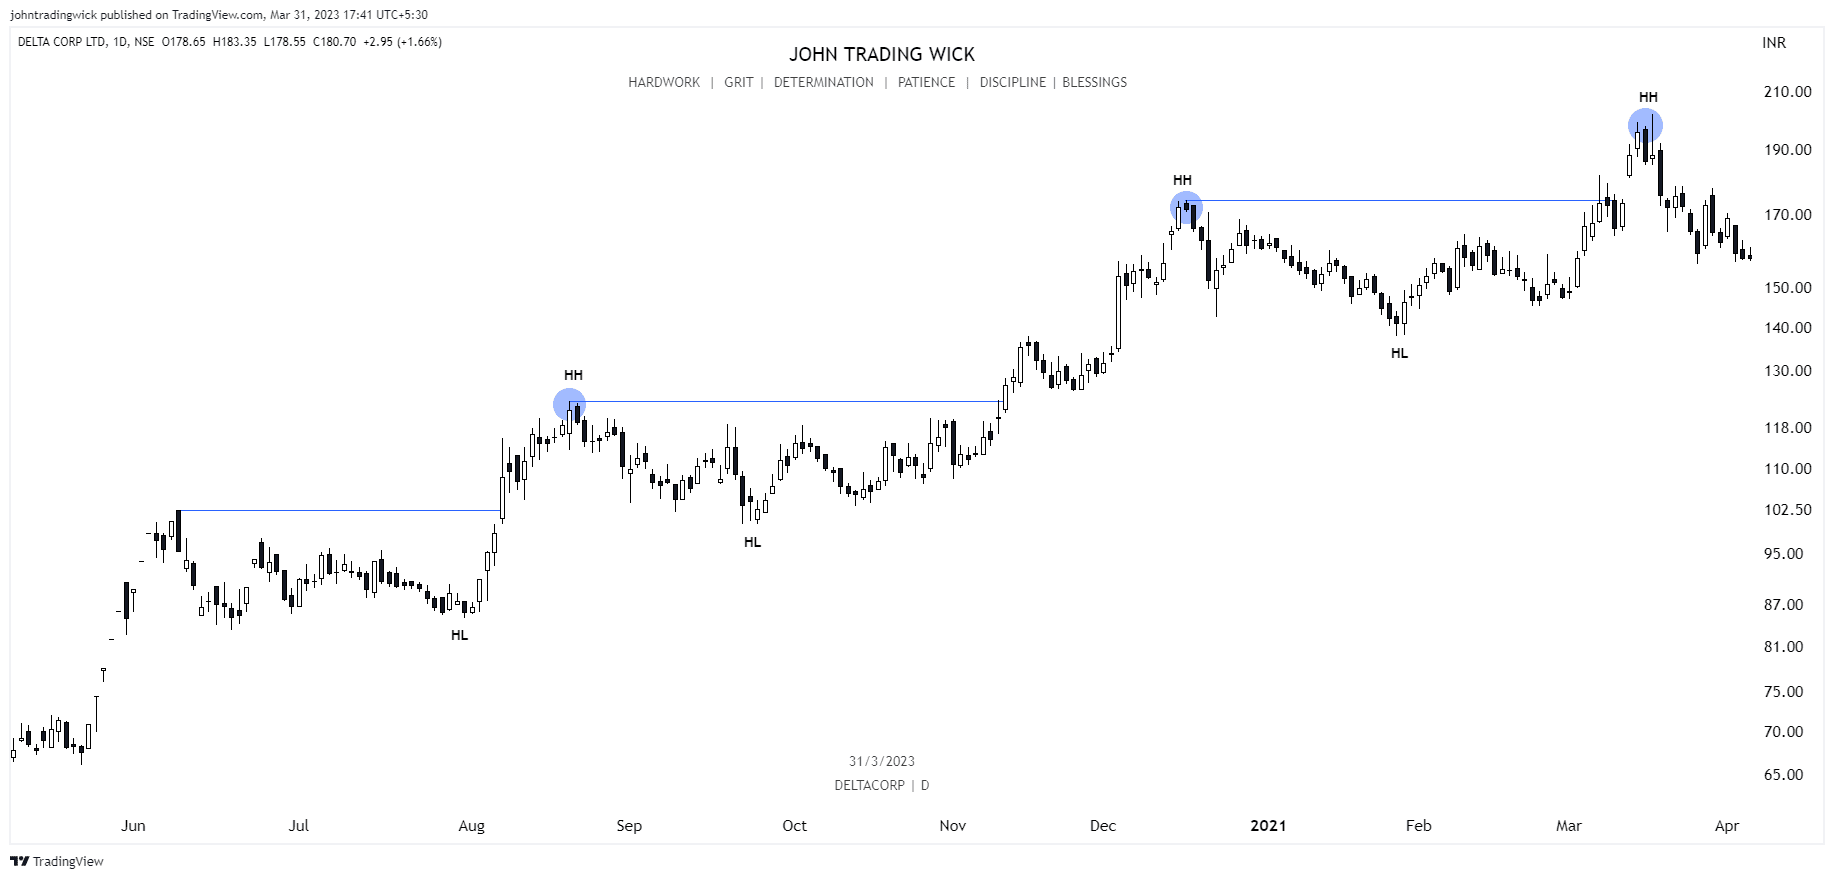
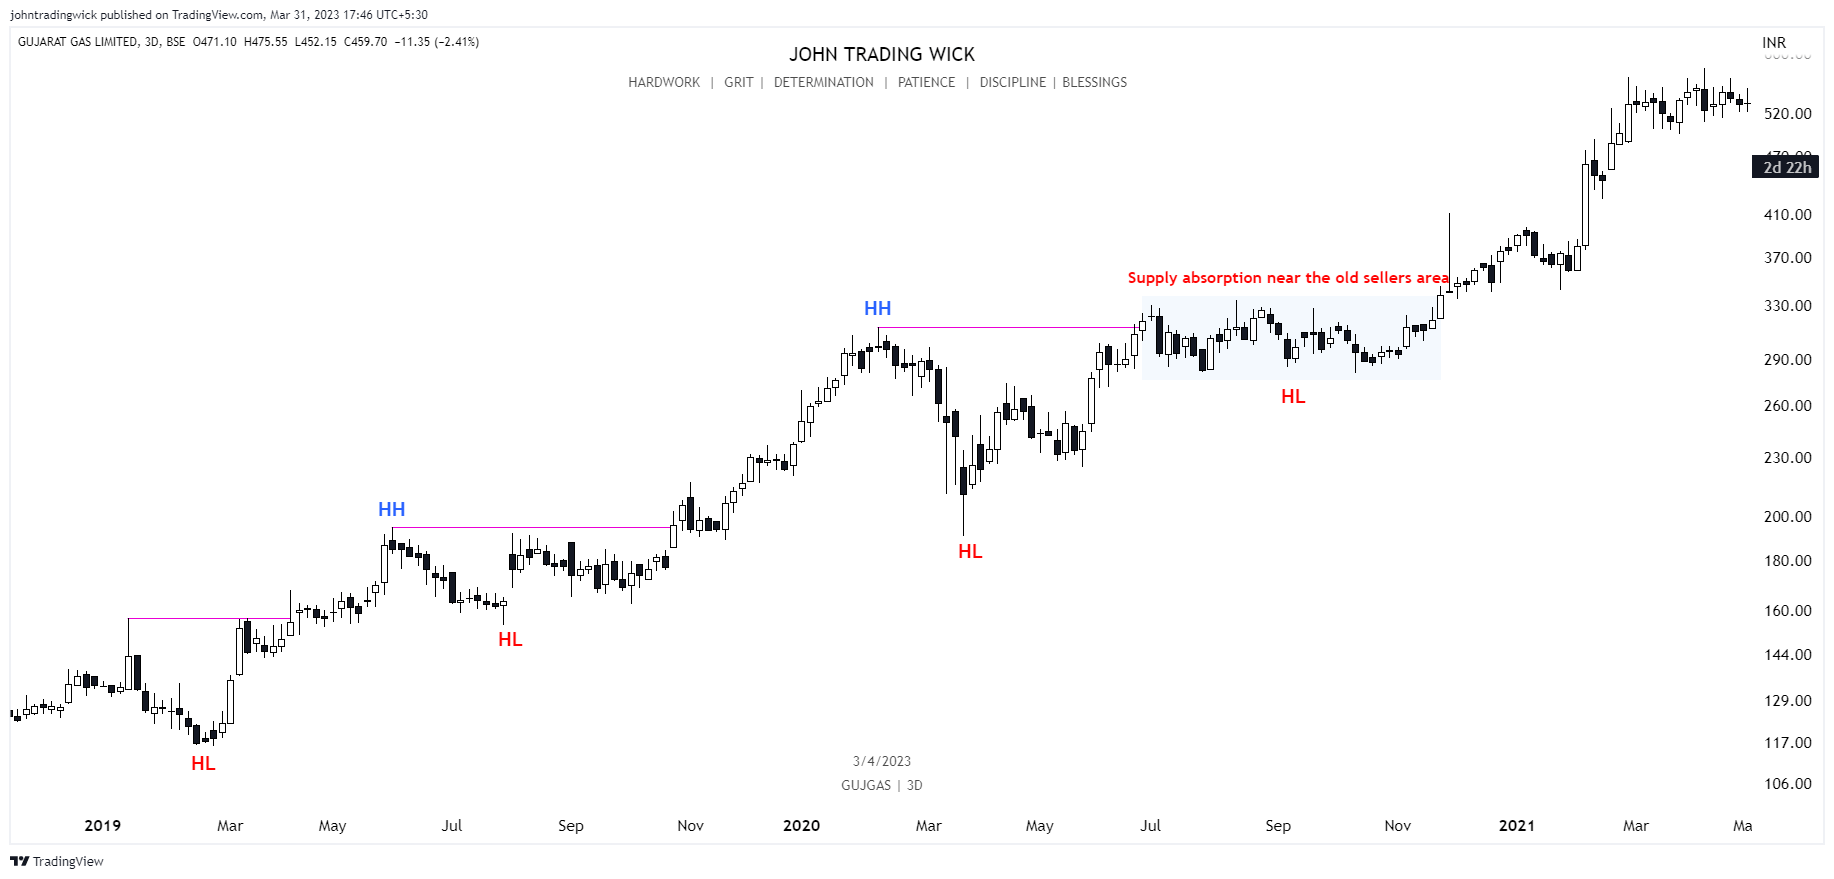
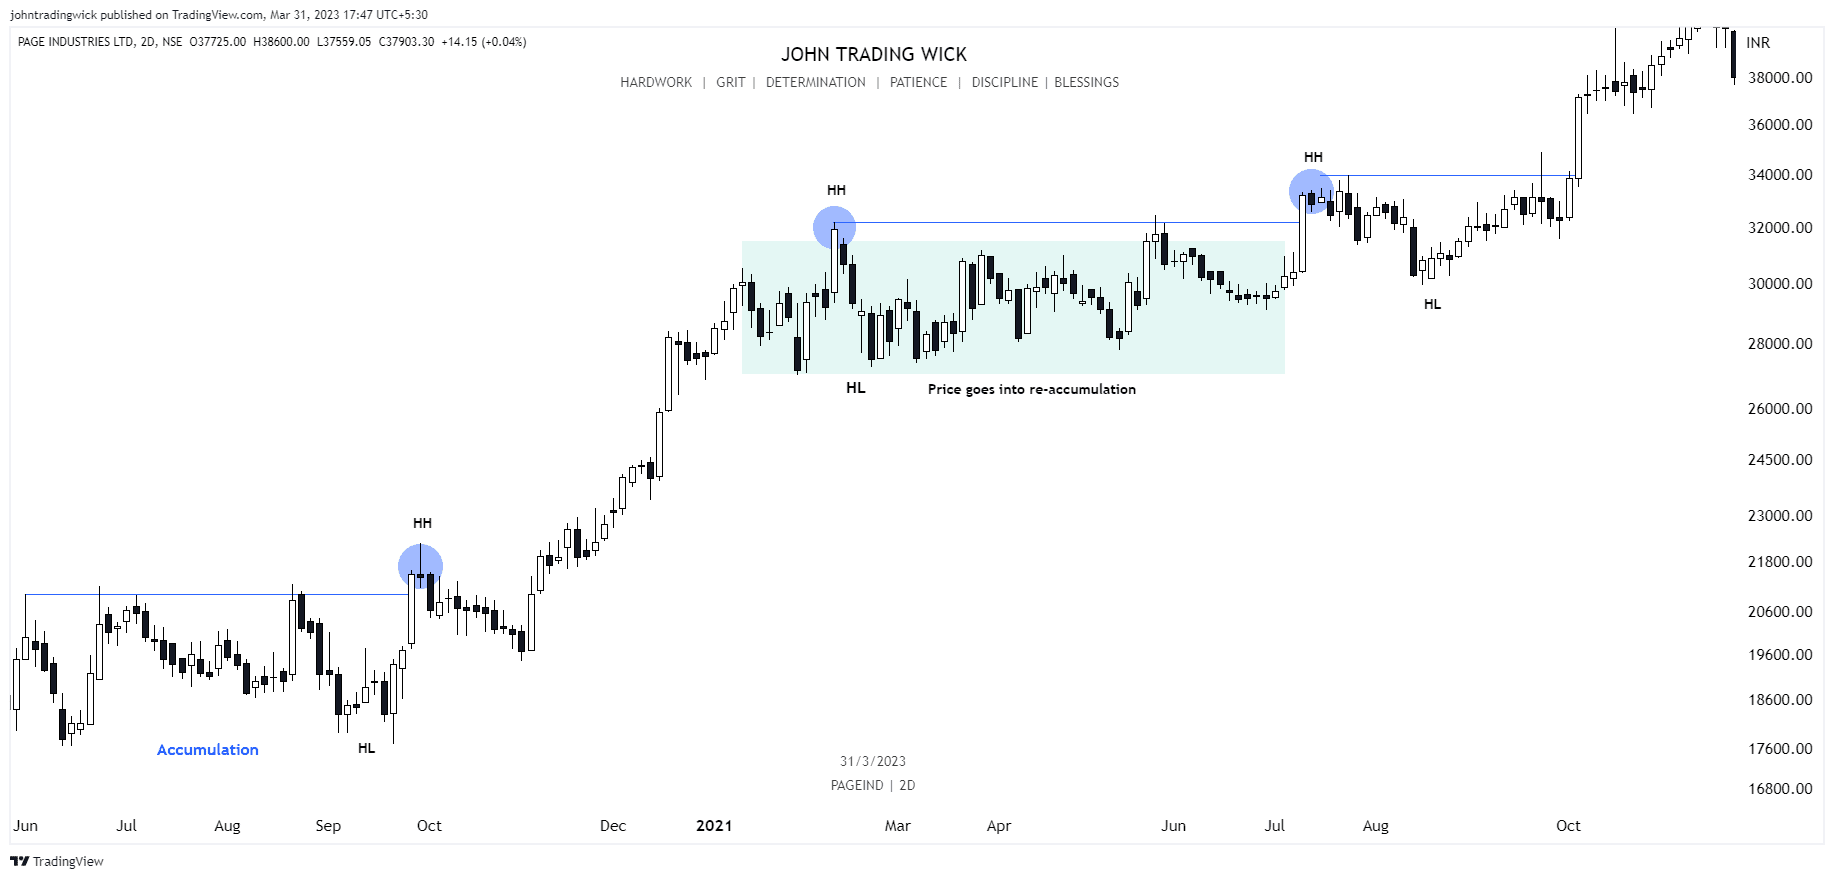
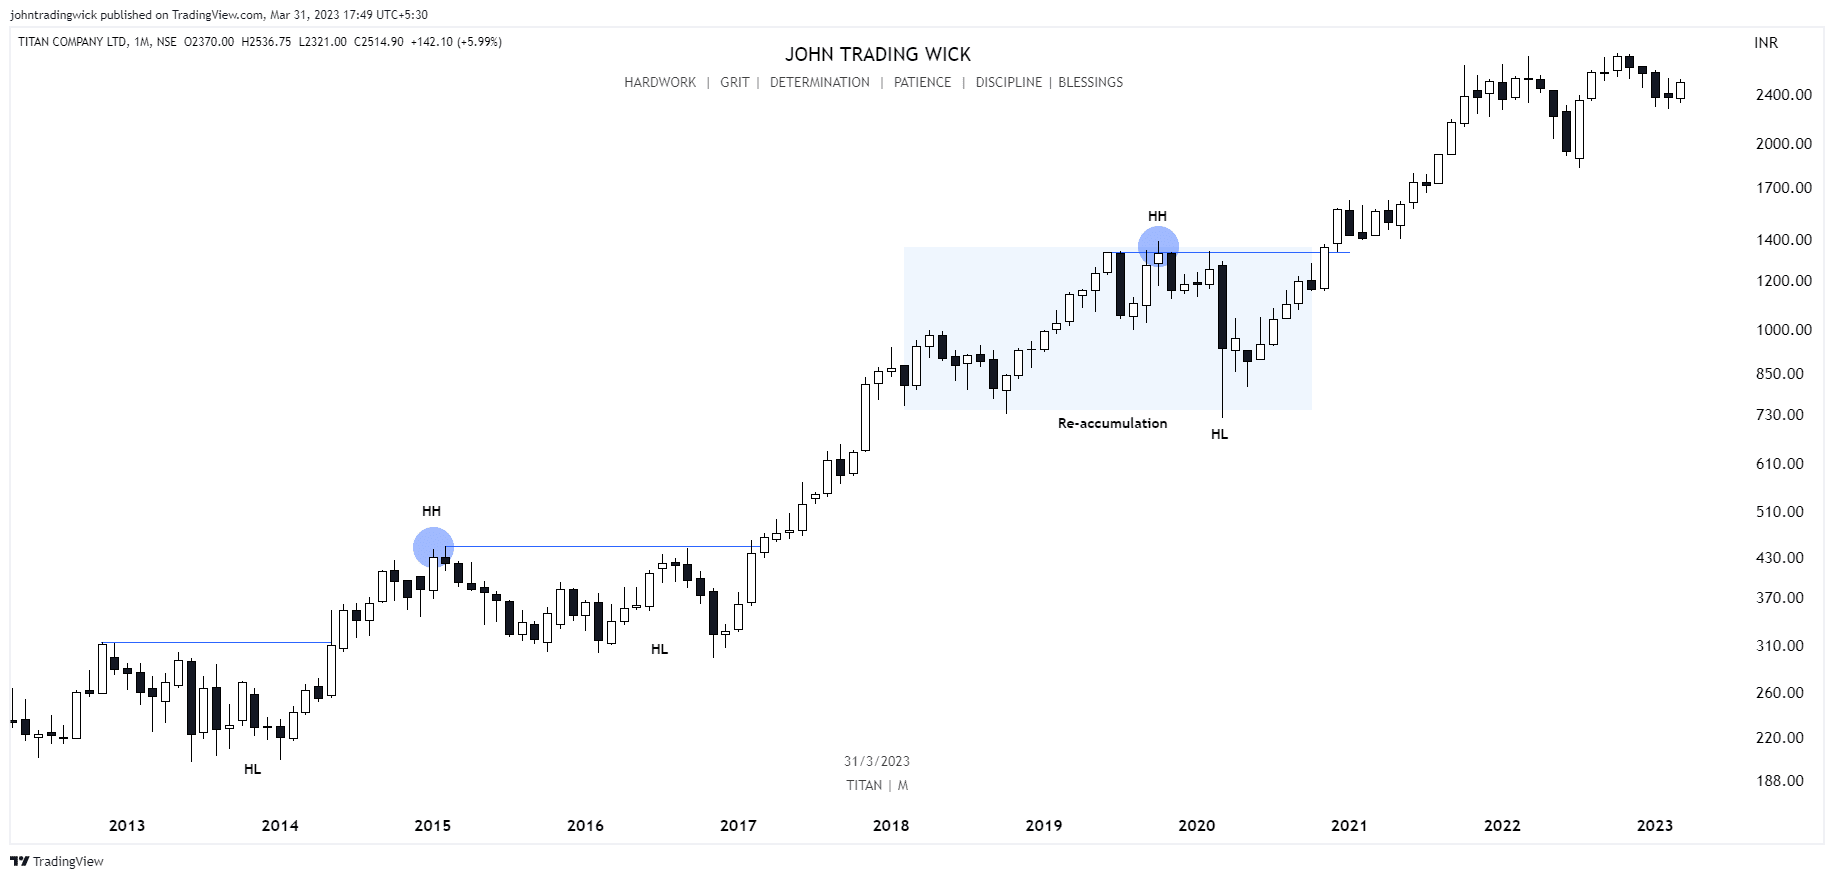
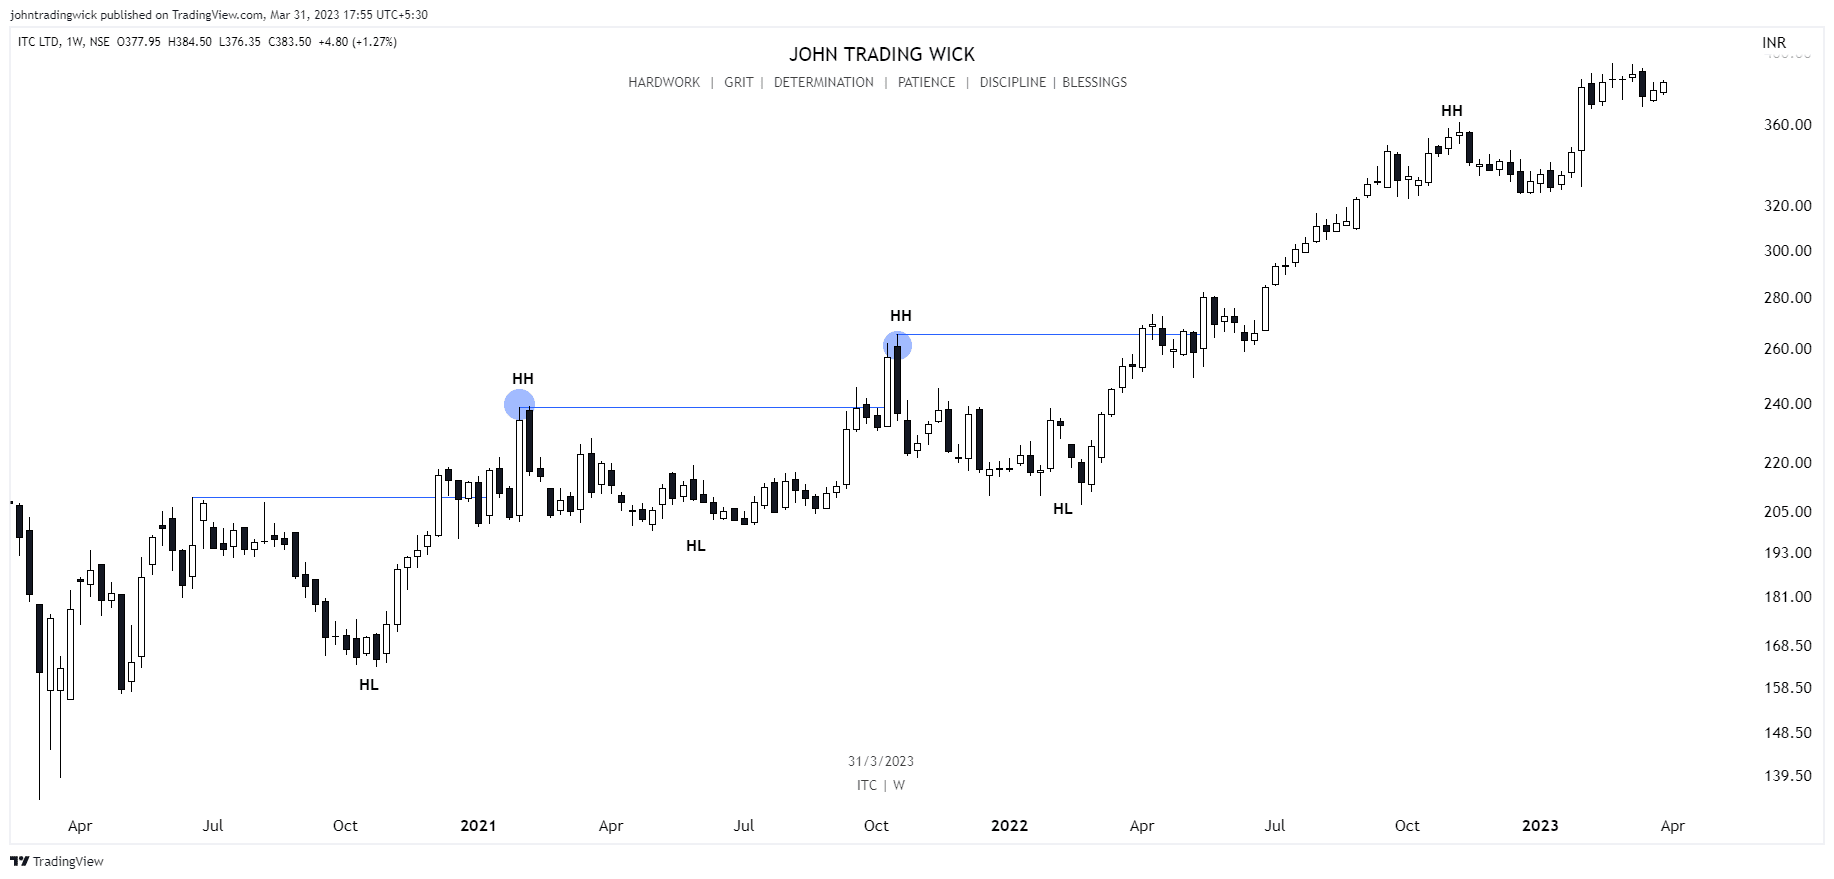
It’s determined by identifying swing highs and swing lows on a price chart, which represents the path the price takes from one point to another. In essence, market structure is the visual representation of the trend in the market. For instance, in a bullish trend, you’ll see a series of higher highs and higher lows, while in a bearish trend, the price will form lower highs and lower lows.
The market structure allows you to be in sync with the market and avoid counter-trend trading, which enhances the probability of your setups.
How to draw and find market structure?
- To assess the structure, we start by connecting the swing highs and swing lows on a price chart to reveal the trend.
- If the price is forming a series of higher highs and higher lows, it indicates a bullish structure, suggesting that buyers are in control.
- Conversely, if the price is forming lower highs and lower lows, it points to a bearish structure, indicating that sellers are dominating the market.
- Although identifying market structure seems simple, it requires practice and experience to master the art of reading price charts accurately
Types of the Market trends:
As a trader, it’s essential to recognize that the market can trend in three different directions. Being able to identify when a shift in the trend occurs based on the timeframe you’re observing is crucial to profitable trading. The three types of market trends are:
1. Bullish (Uptrend)
2. Bearish (Downtrend)
3. Ranging (Sideways)
Type of Market structure
There are broadly 3 types of structure.
1. Bullish structure
2. Bearish structure
3. Ranging/sideways structure
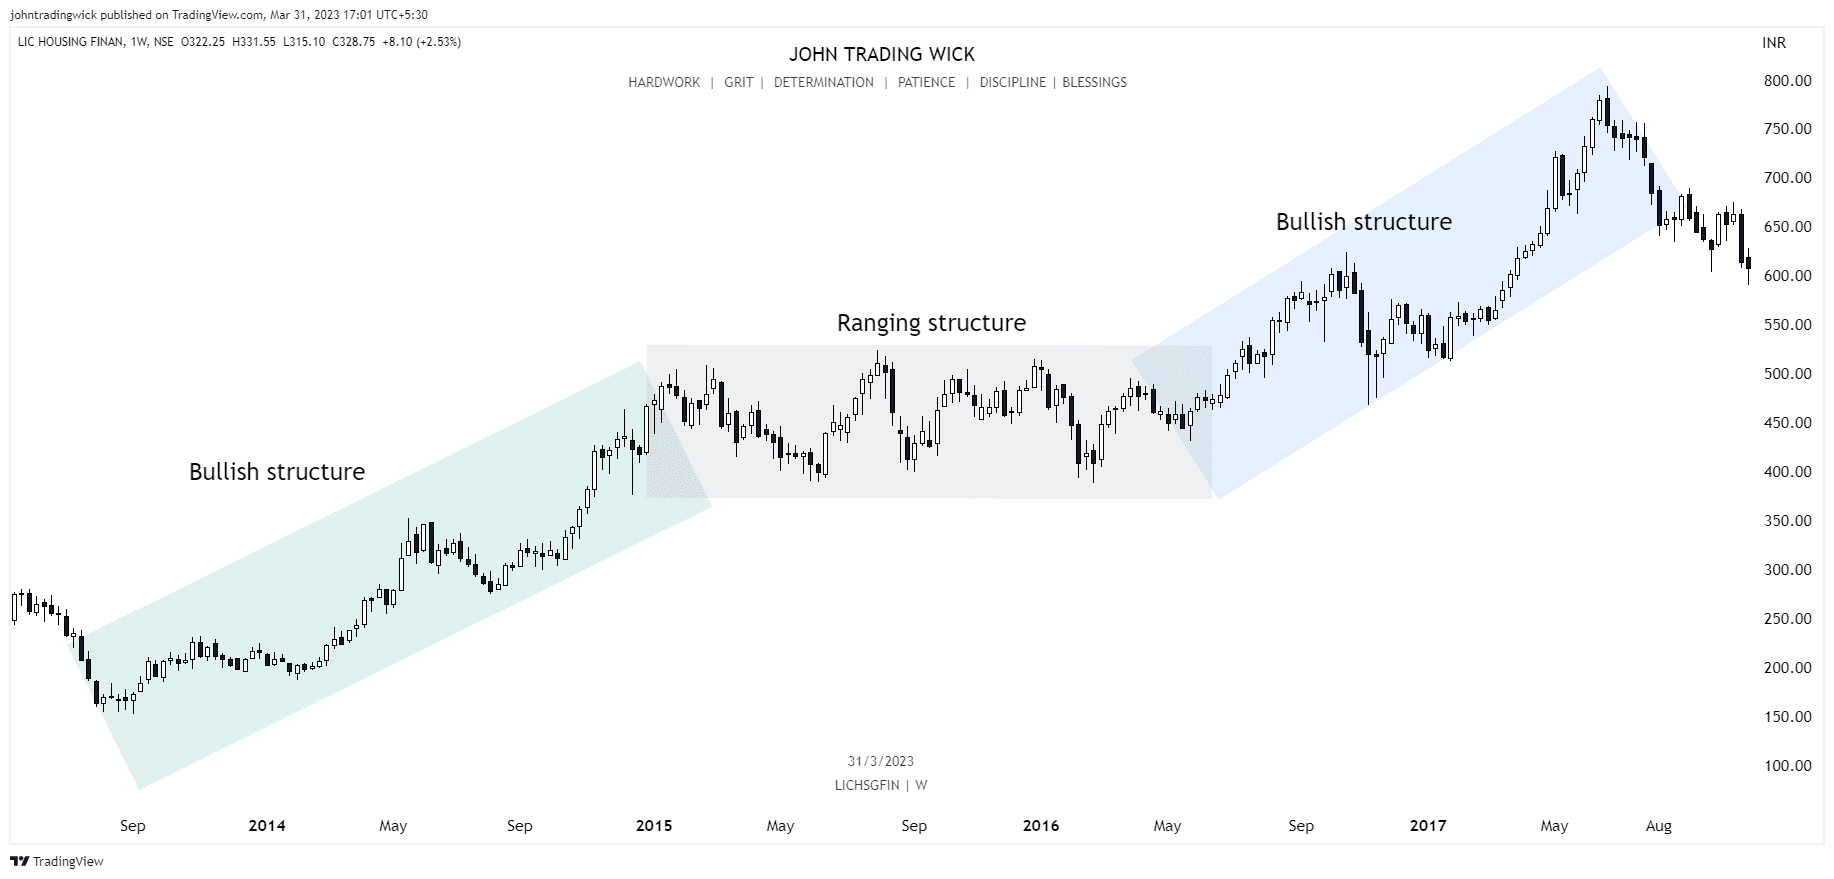
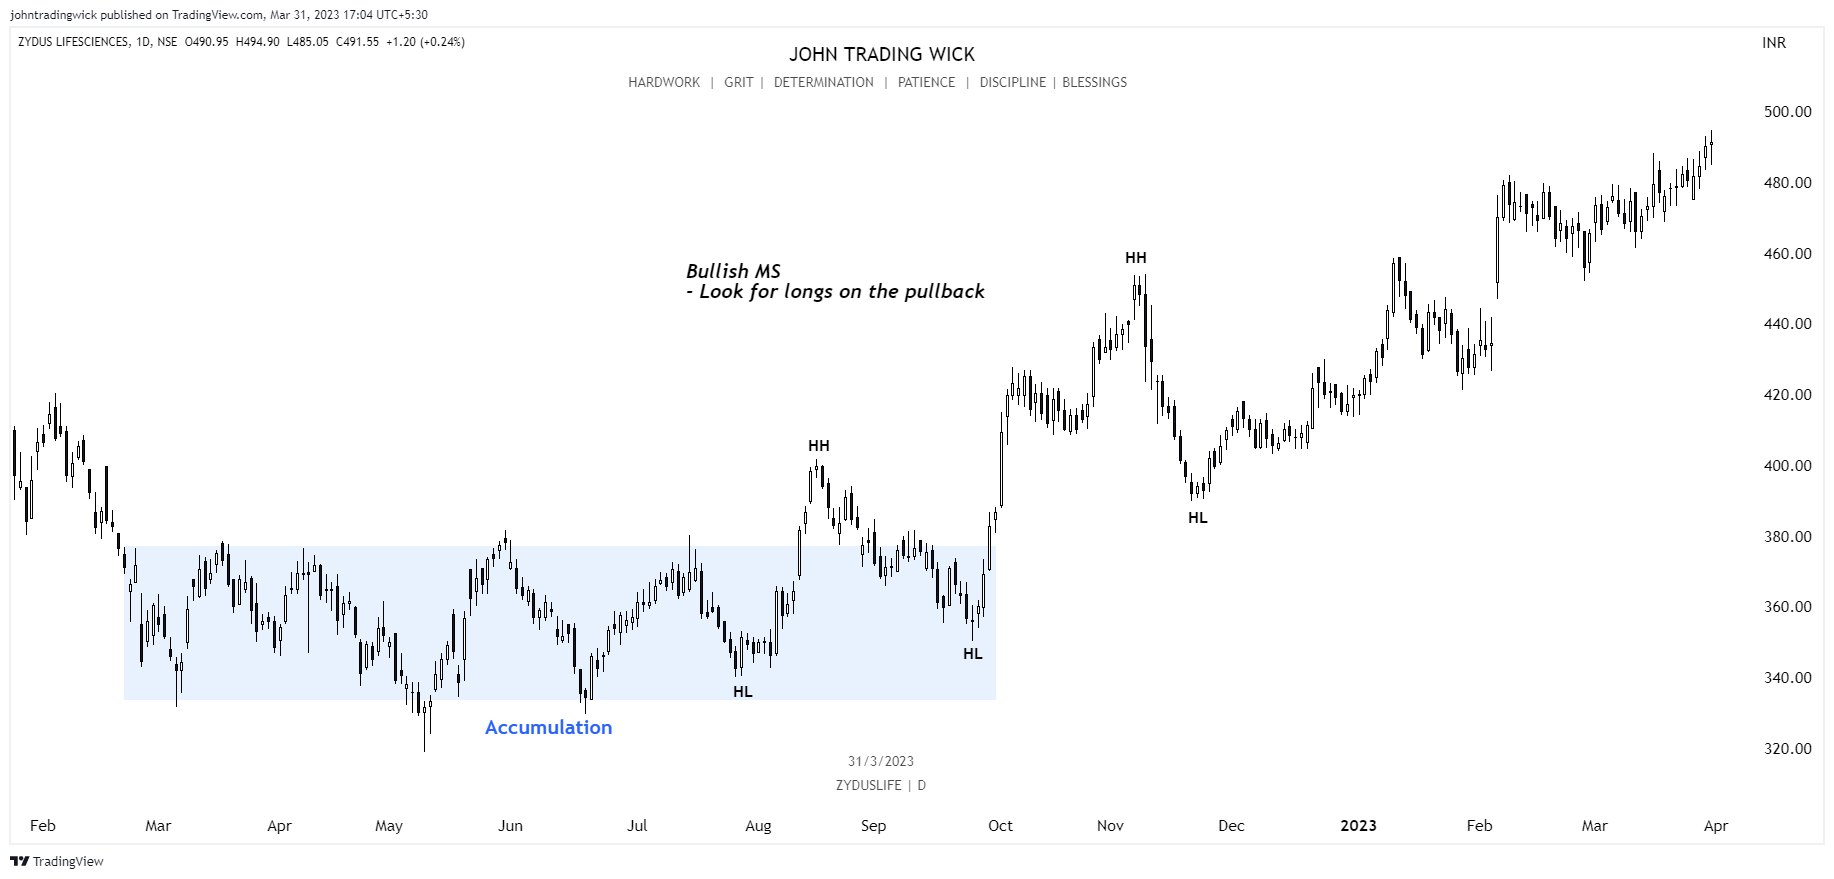
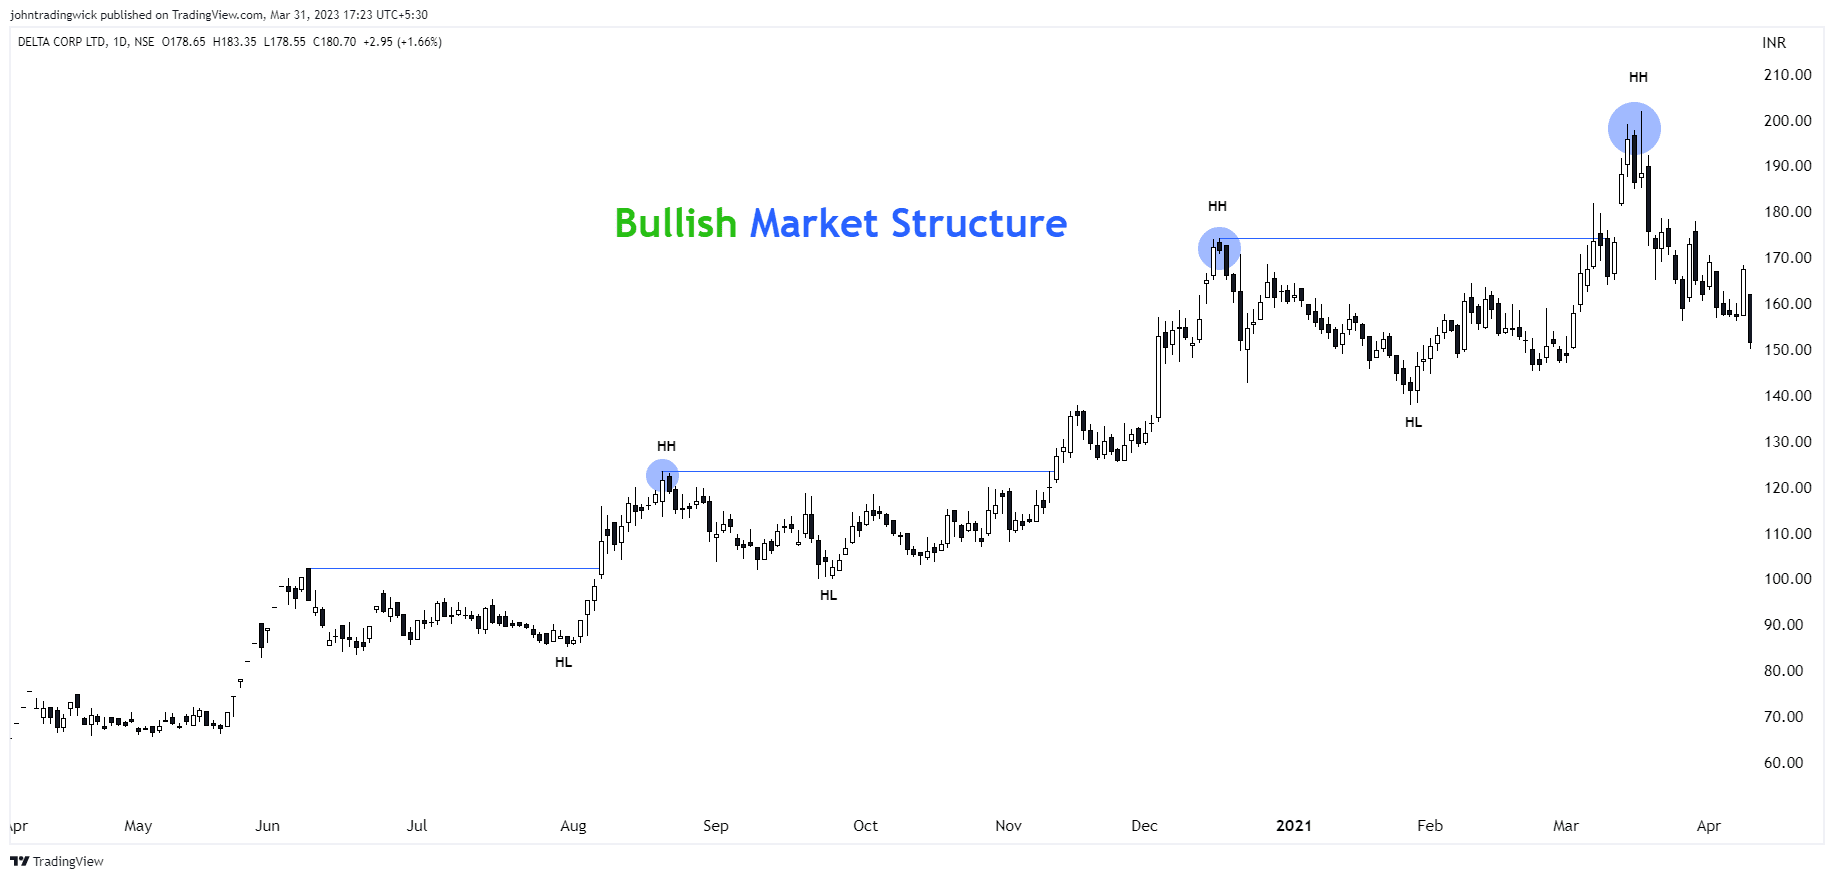
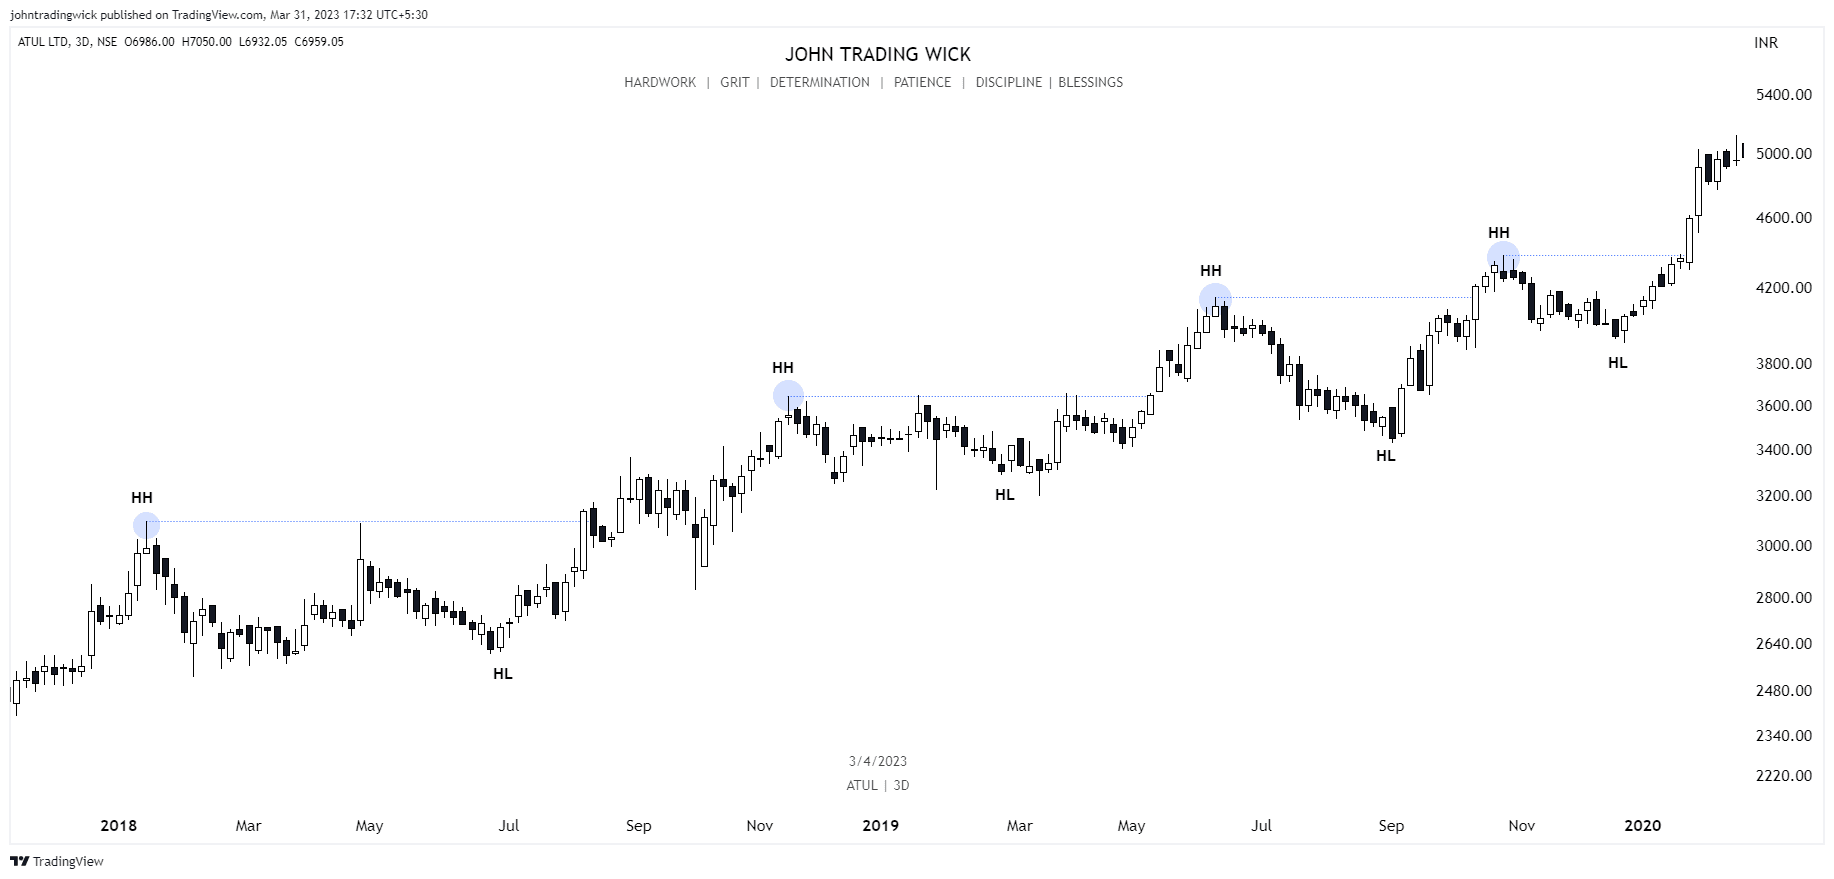
Illustration: Bullish market structure
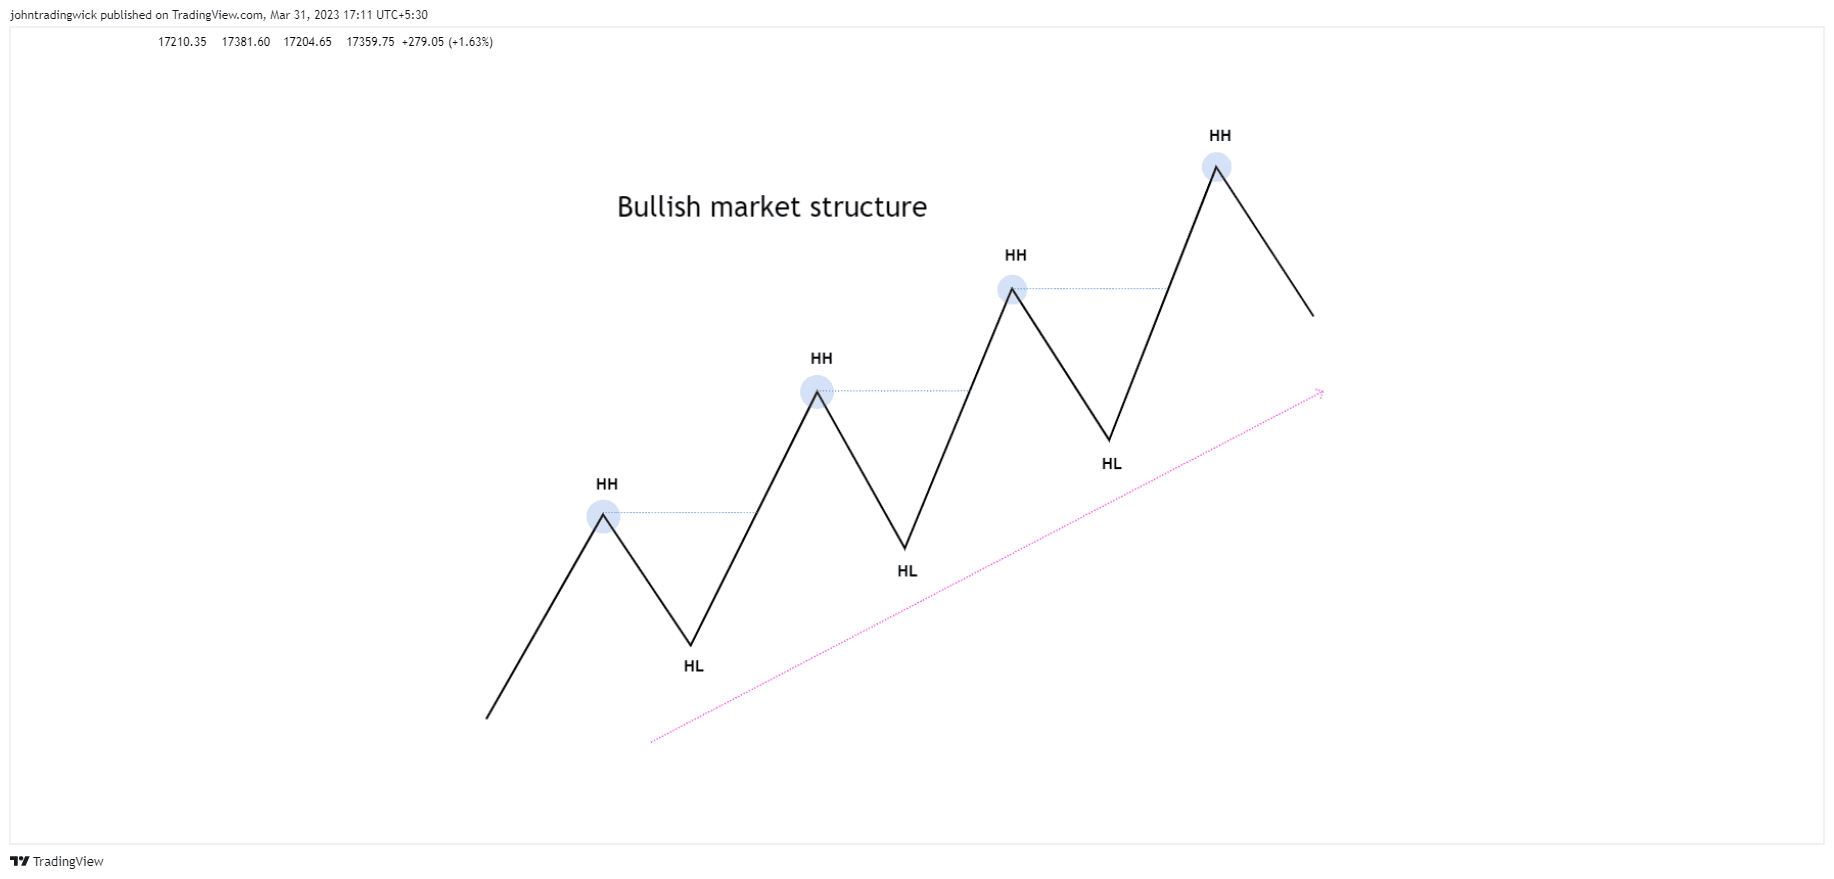
In a bullish market, the price forms a series of higher highs and higher lows.
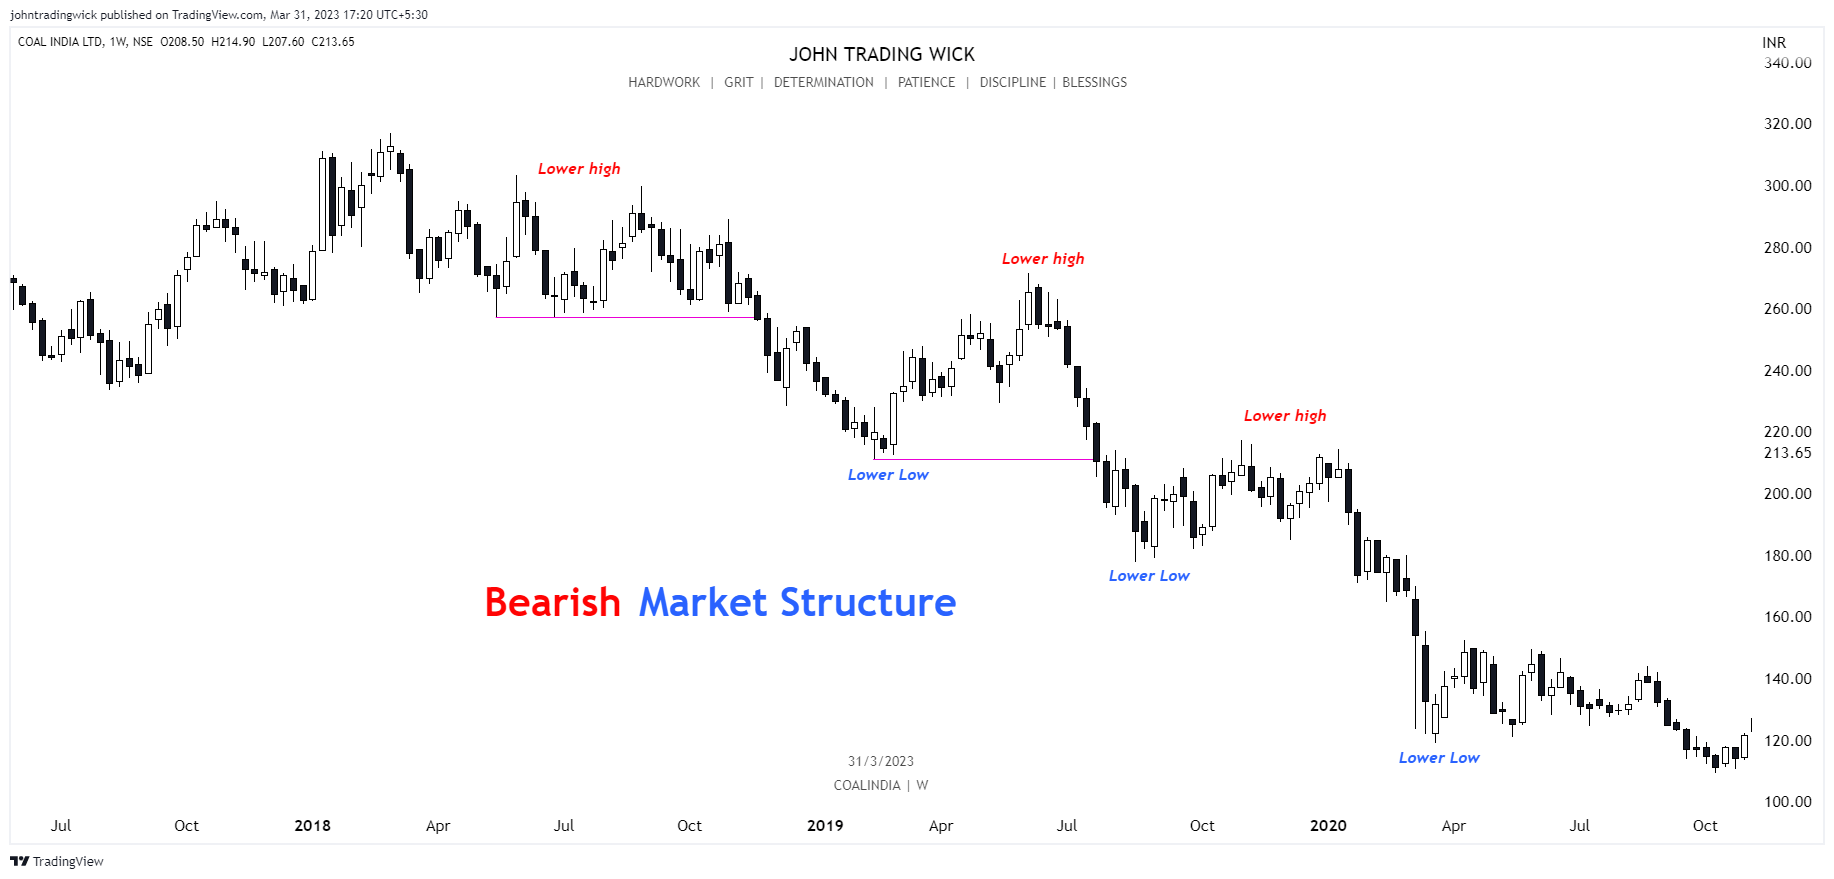
Illustration: Bearish market structure
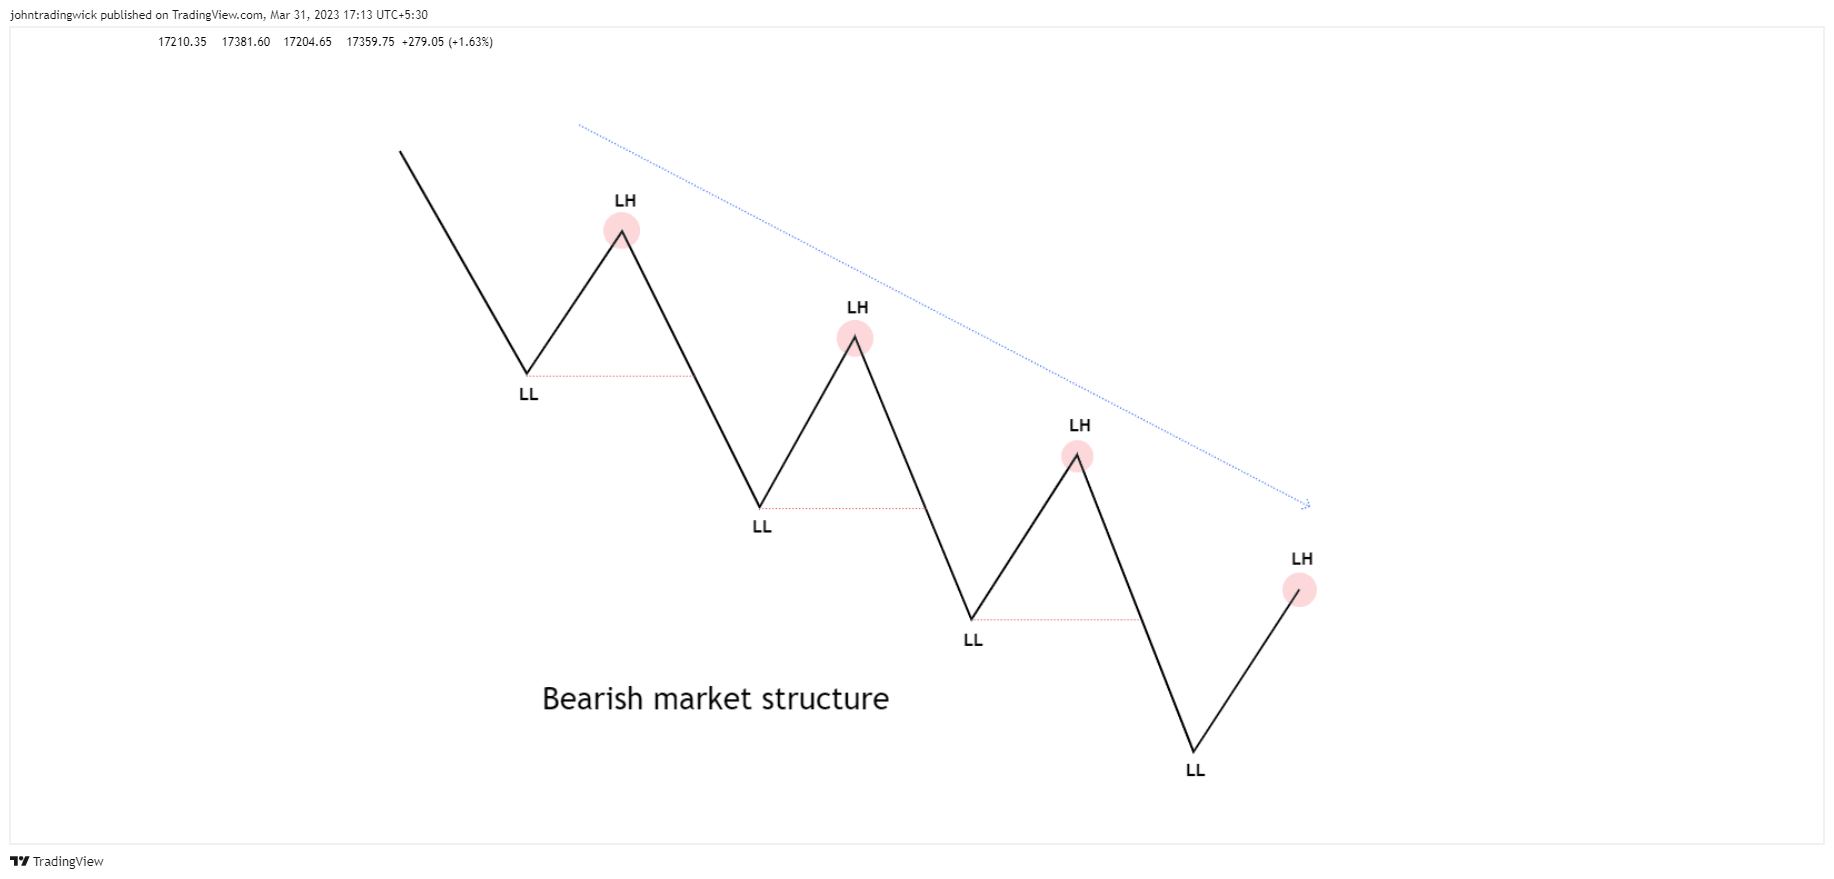
In a bearish market, the price forms a series of lower highs and lower lows.
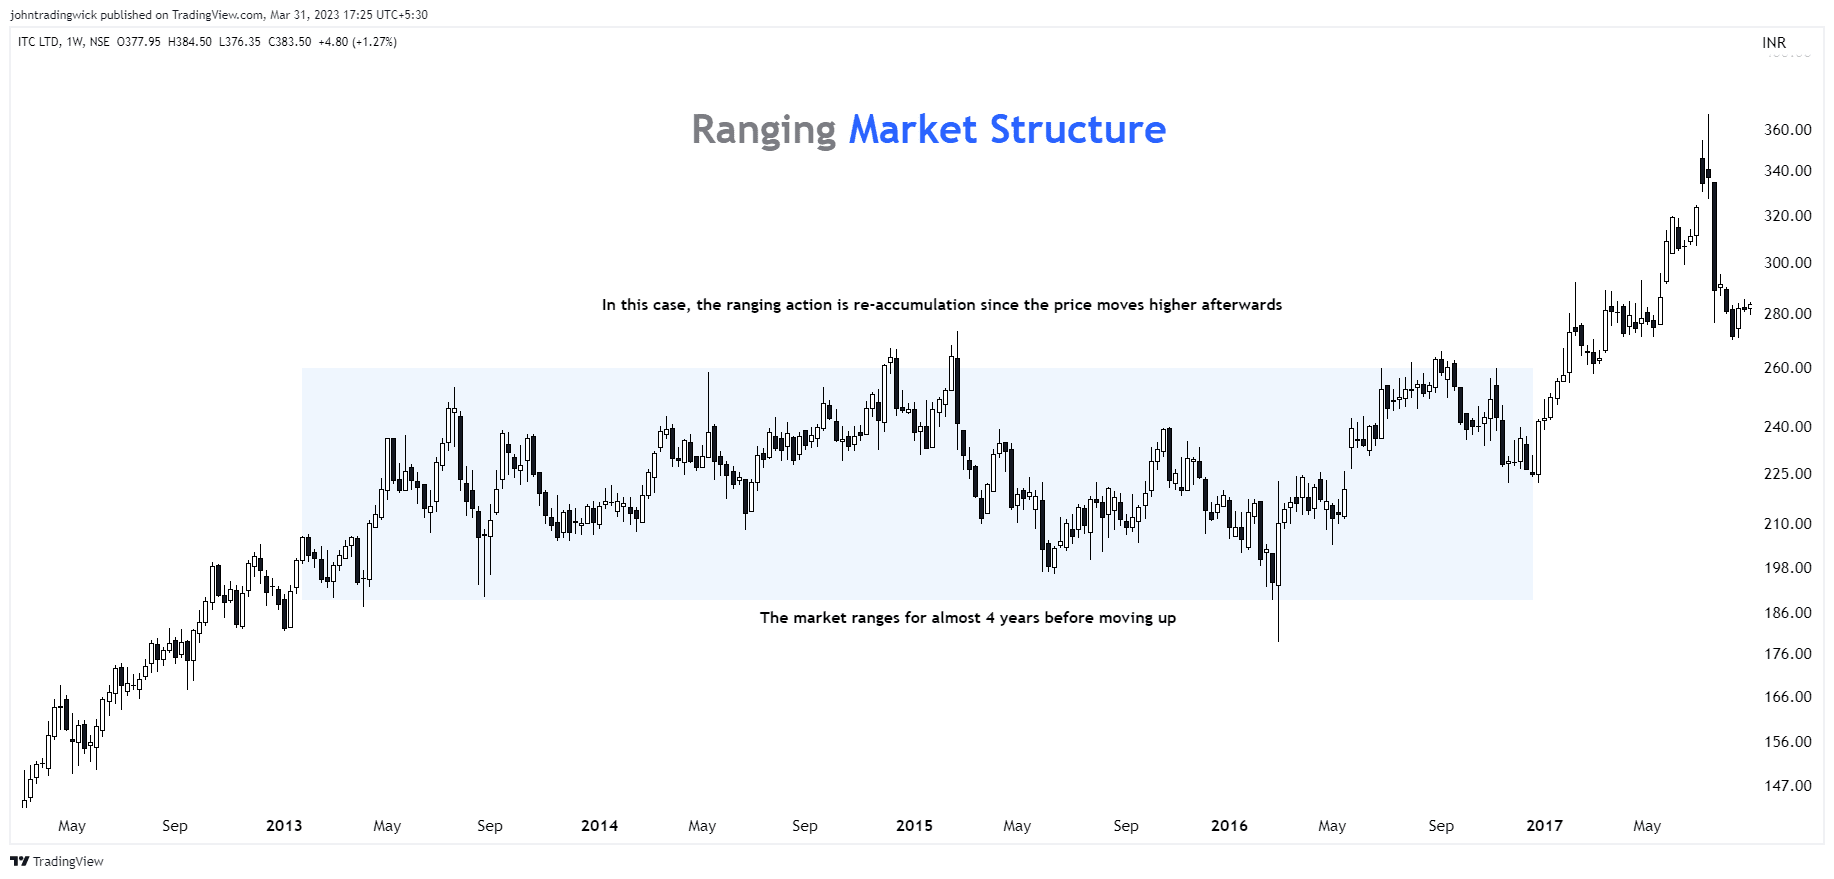
Illustration: Ranging/sideways market structure
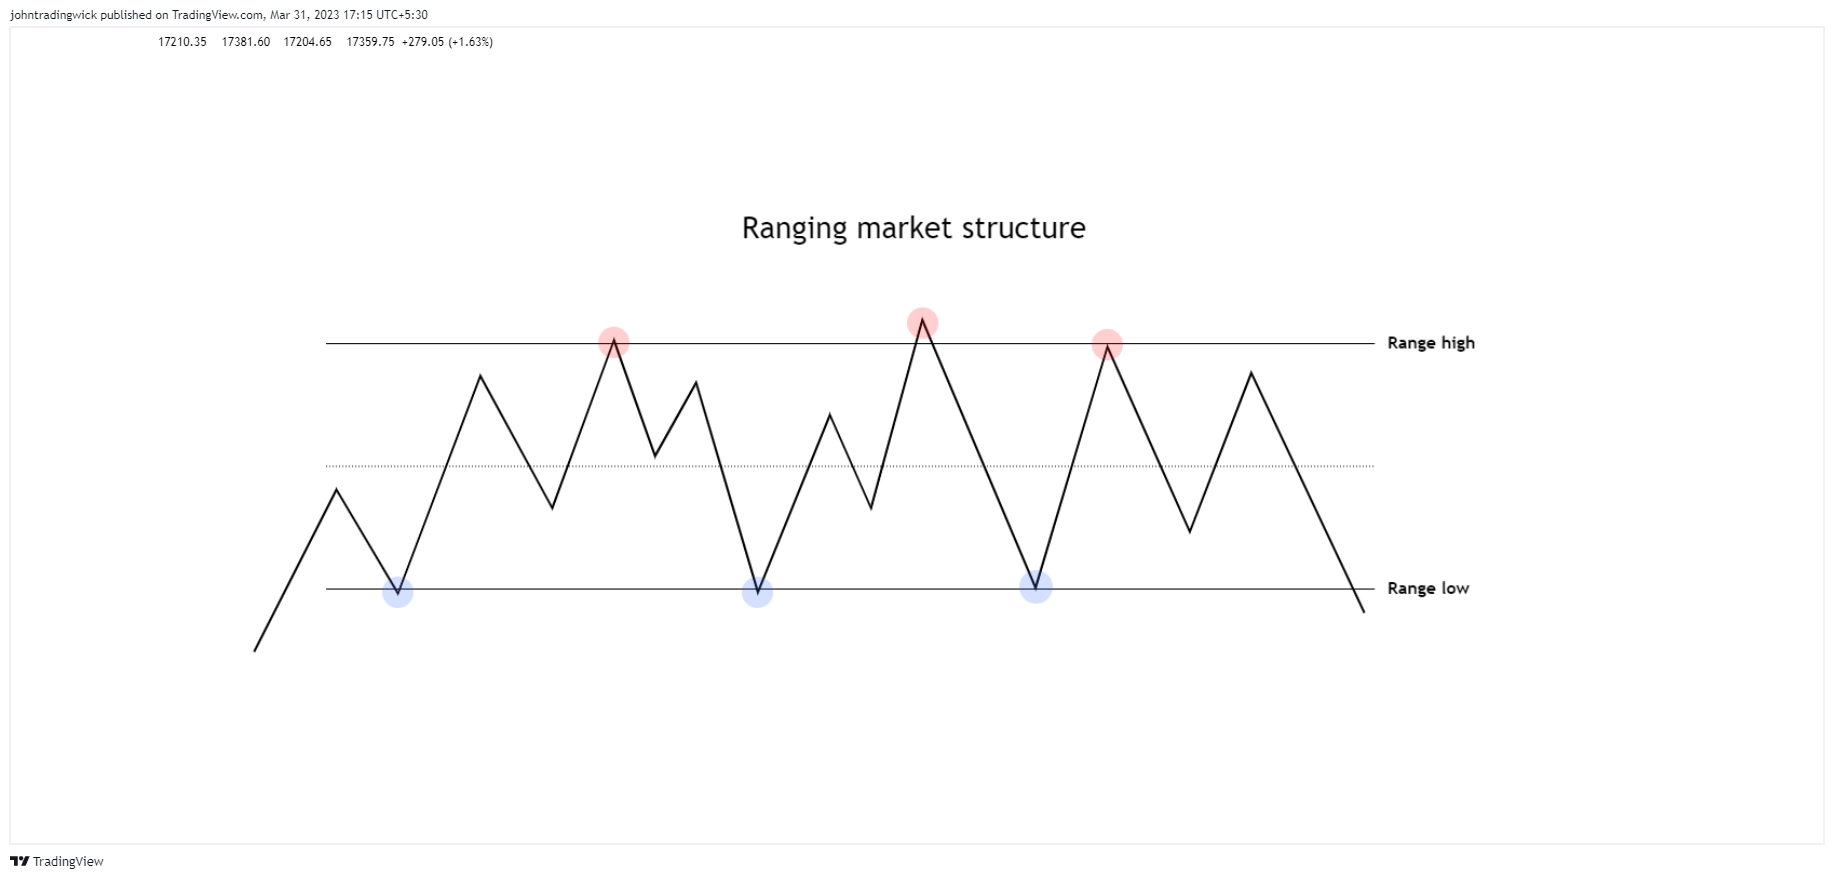
In a ranging market, the price may form a series of relatively equal highs and lows.
What is an uptrend?
✅ Characterised by a bearish market structure.
✅ Formation of lower highs followed by lower lows.
✅ For a downtrend to stay intact, it must preserve its descending structure – lower highs must follow lower lows.
✅ Lower highs are allowed if the price goes into compression or re-distribution.
What is a downtrend?
✅ Characterised by a bearish market structure.
✅ Formation of lower highs followed by lower lows.
✅ For a downtrend to stay intact, it must preserve its descending structure – lower highs must follow lower lows.
✅ Lower highs are allowed if the price goes into compression or re-distribution.
What is a range?
✅ A range is a zone where the price finds itself bouncing between two levels.
✅ These levels are – range high and range low.
✅ The size of the range is dependent on different factors such as asset class, demand-supply, volatility, etc.
A lot of times, the structure won’t be as clear as you want it to be. Conversely, sometimes the structure will replicate the textbook. Hence, you need to be flexible in your approach.
Sometimes, trading in range-bound markets can be challenging due to the choppiness in price movements. However, when the price action is more defined, some traders may prefer to trade the range by executing breakout trades or mean reversion trades from the range high to the range low or vice versa.
It is better to combine market structure with other concepts/indicators for better results.
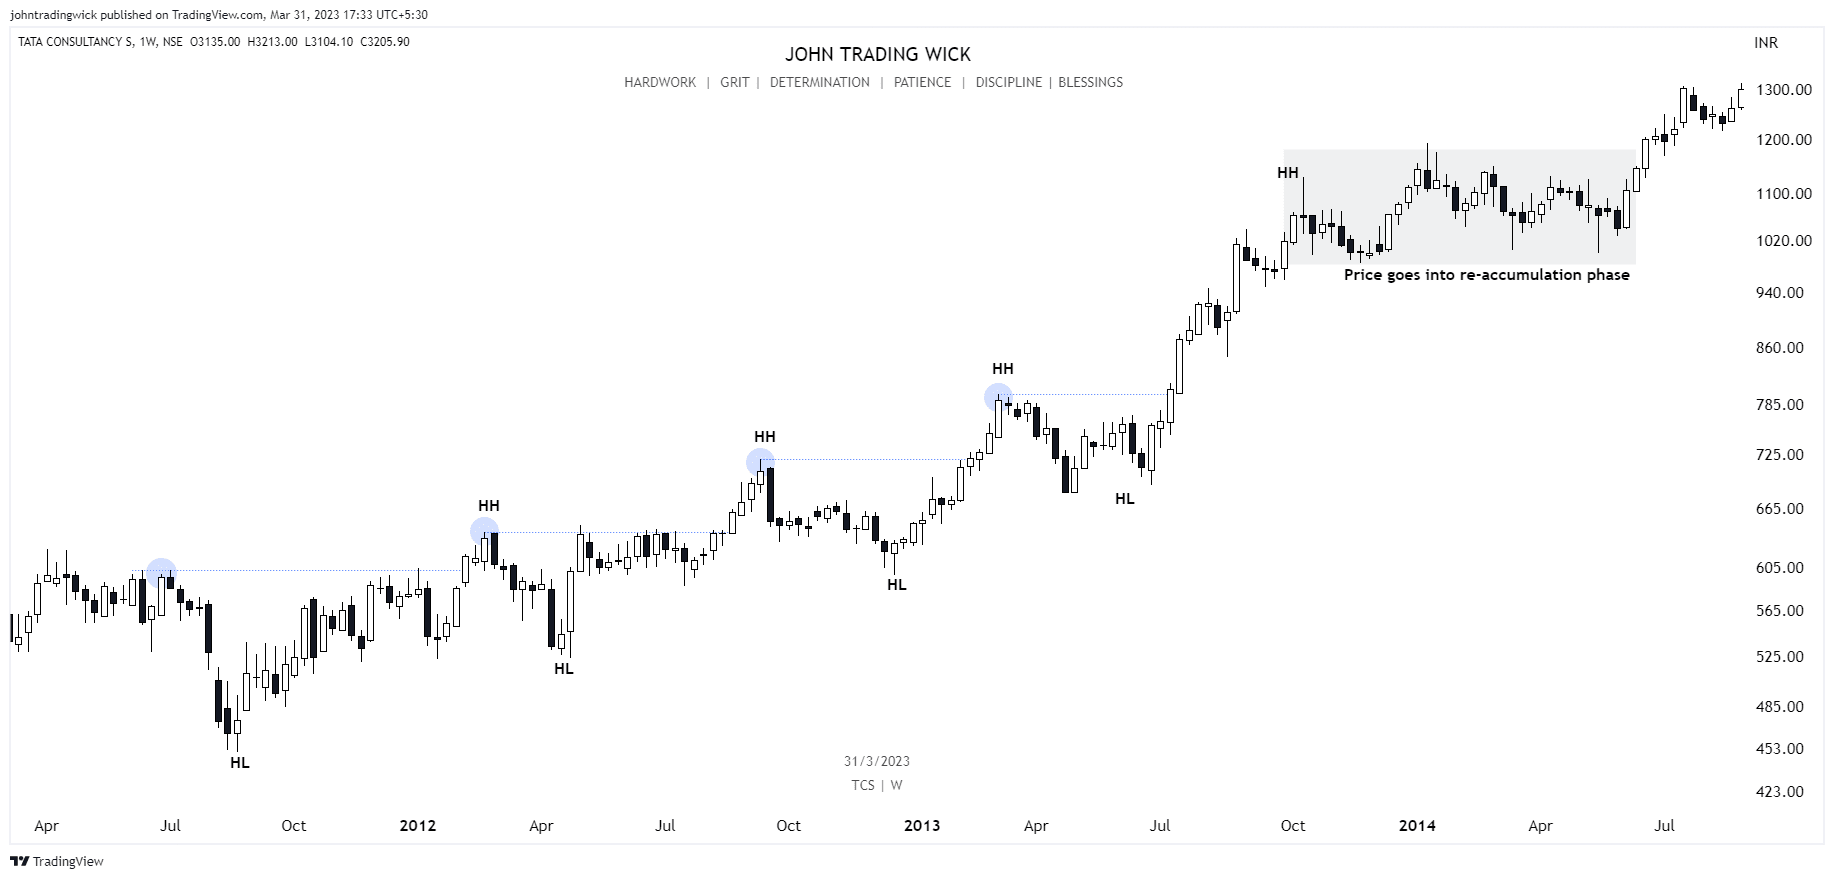
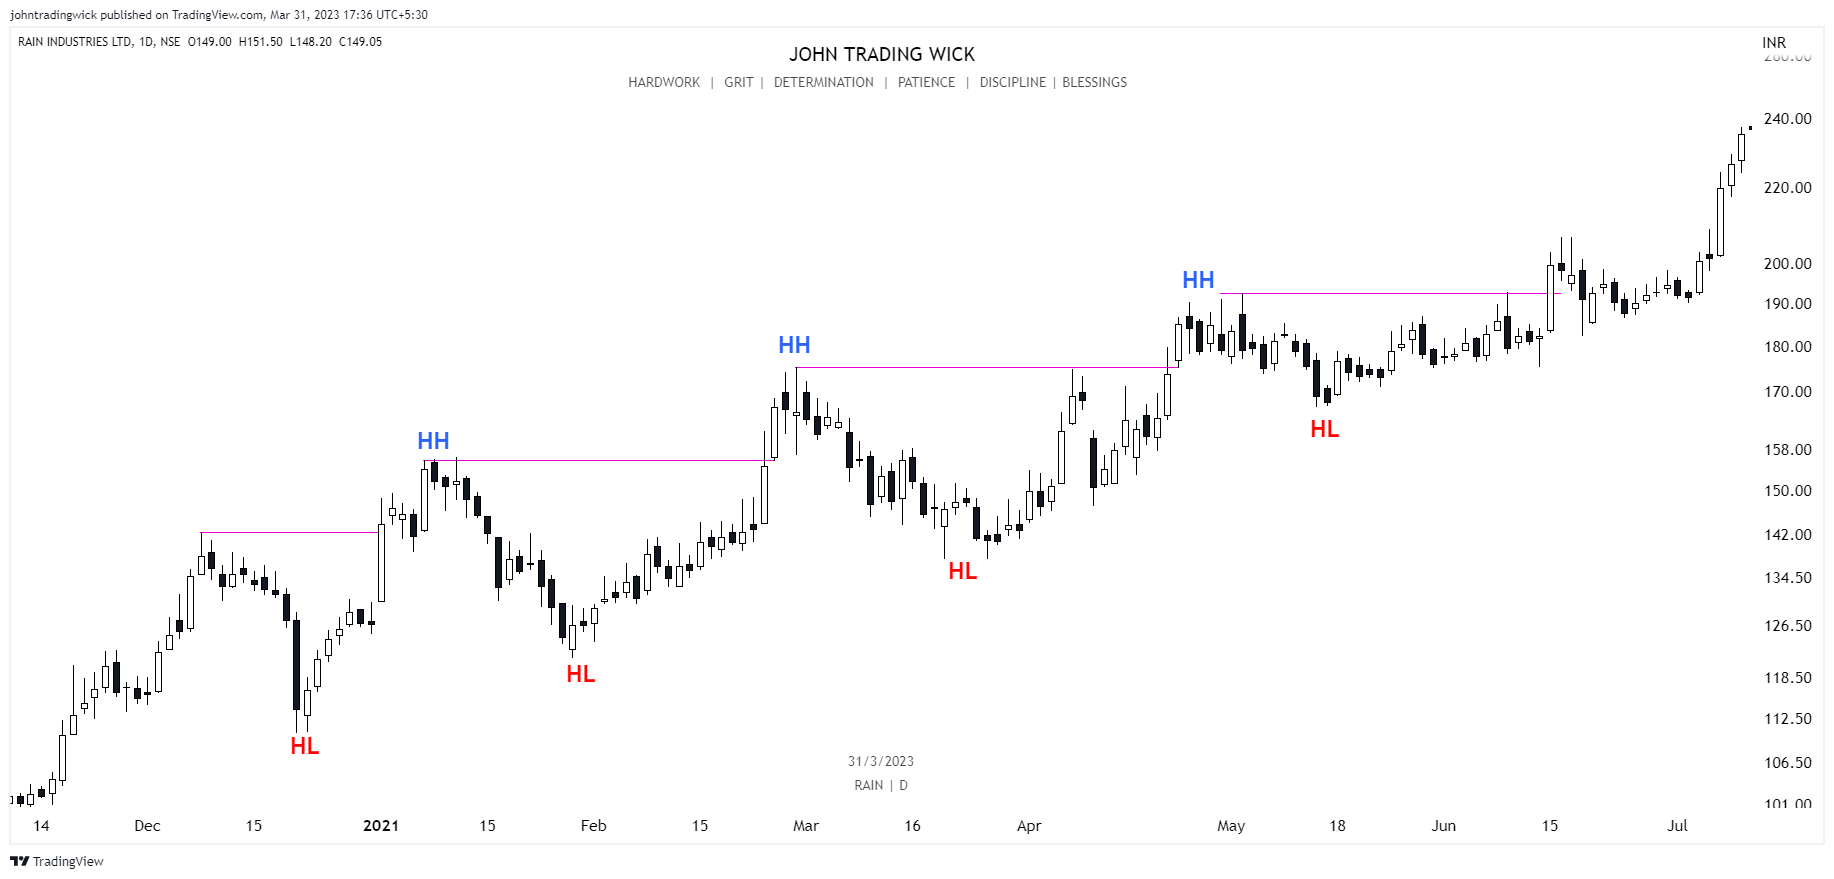
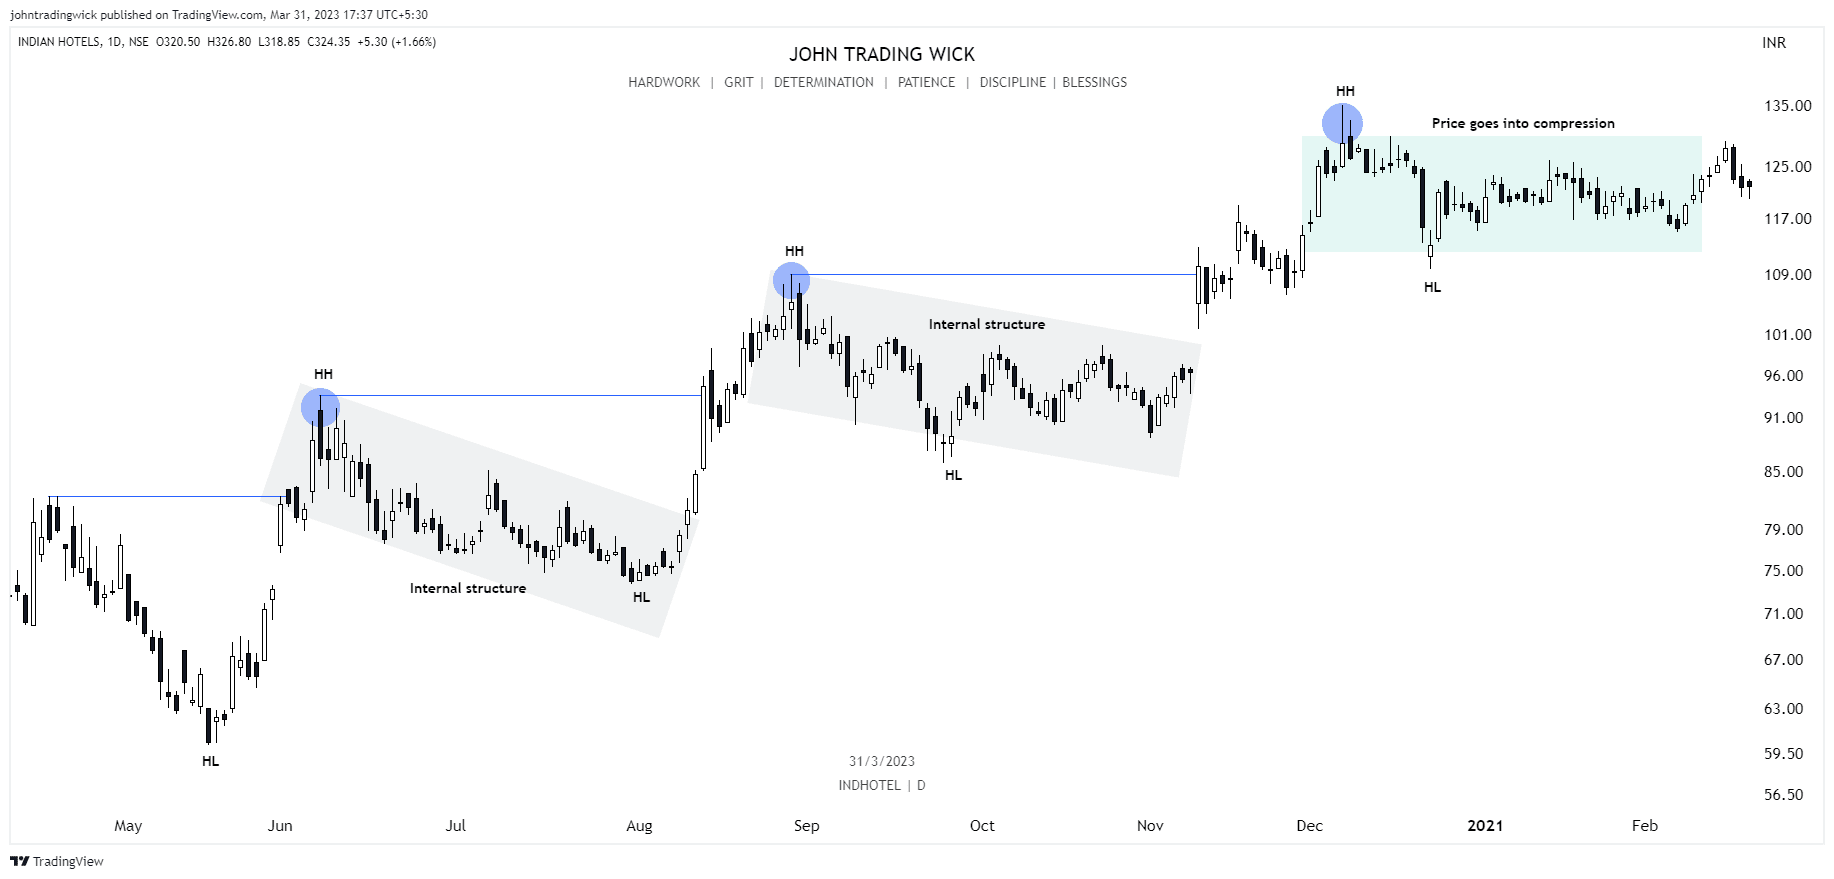
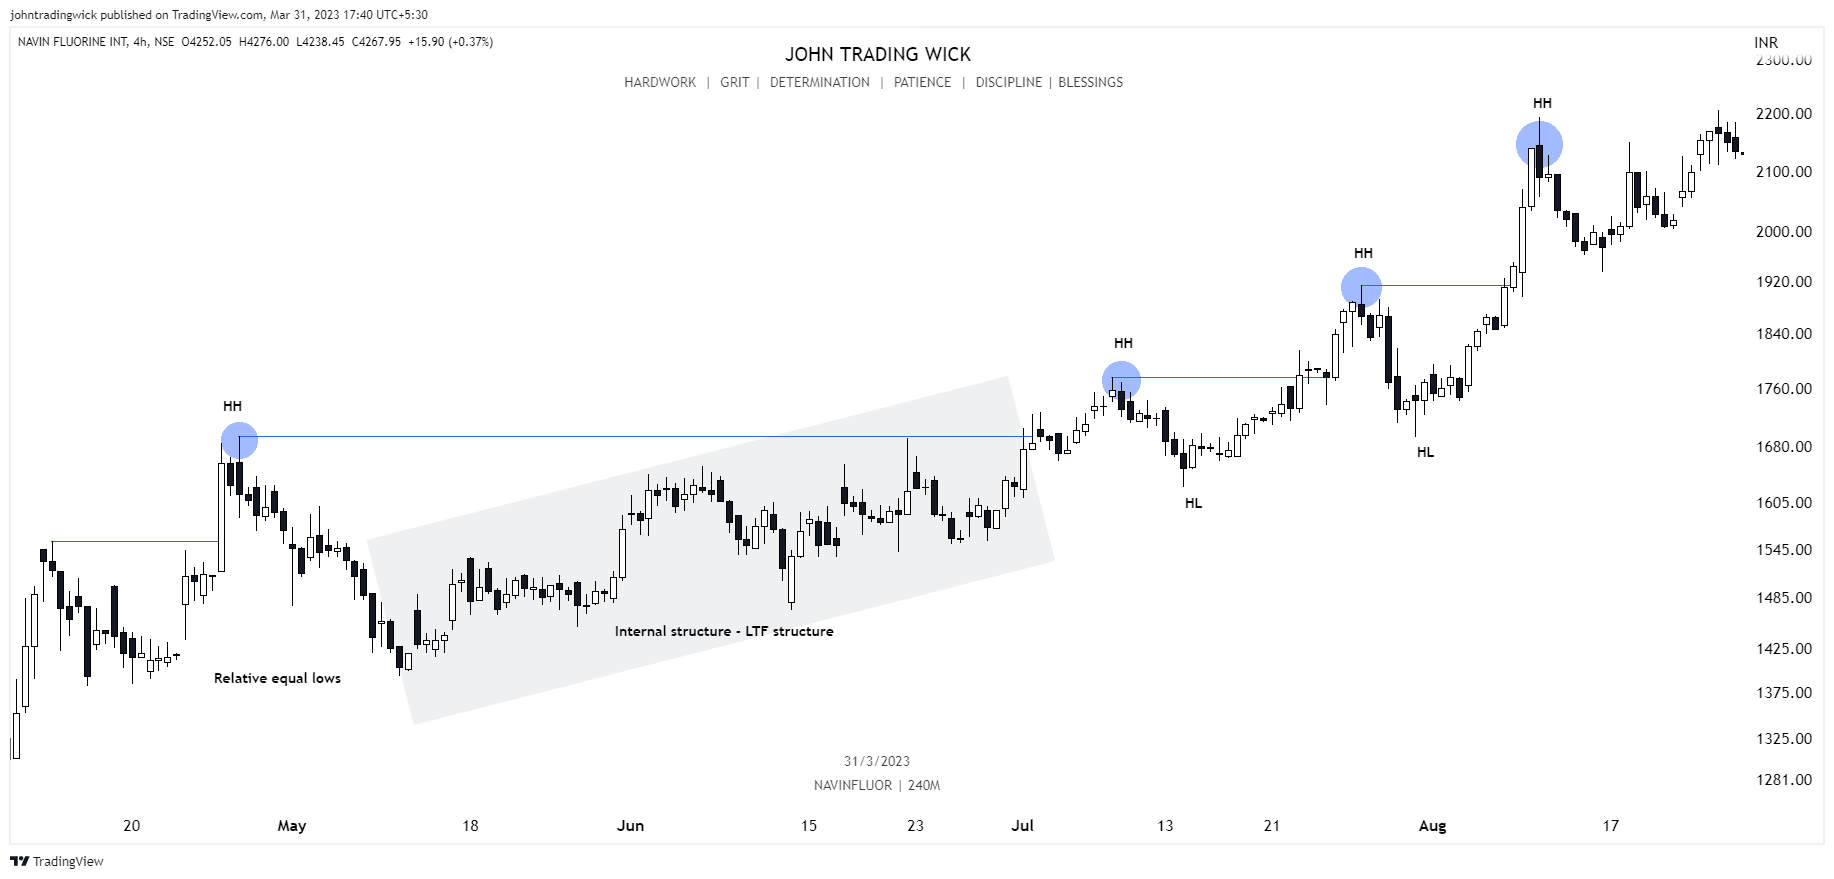
Exhibits: Bullish market structure
Like this article? Don’t forget to share it! Follow me on Twitter and YouTube for more educational content.