


I have tried with the best of my little knowledge to create this thread and it has everything you need to know about Fibonacci retracement. All you have to do is just read this thread again and again until you get a good grasp of it.
Table of Contents:
1. What are Fibonacci retracement Levels?
2. Significance of retracement levels
3. Finding retracement levels
4. How to use the retracement levels?
5. Difference between Fibonacci retracement and Fibonacci extension.
What are Fibonacci Retracement levels?
• The retracement levels are horizontal lines that indicate areas where the price could stall or reverse.
• These horizontal levels can act as a potential support or resistance levels.
• They are based on Fibonacci numbers. Each level is associated with a percentage which means how much of a prior move the price has retraced.
• The retracement levels are 23.6%, 38.2%, 61.8%, and 78.6%.
• While 50% is not a pure Fibonacci ratio, but it is still used as a support and resistance indicator. This is because people worldwide regard it as an important level.
• The price won’t always bounce from these levels. They should be looked at as areas of interest. Hence, please use the Fibonacci retracement as a confirmation tool.
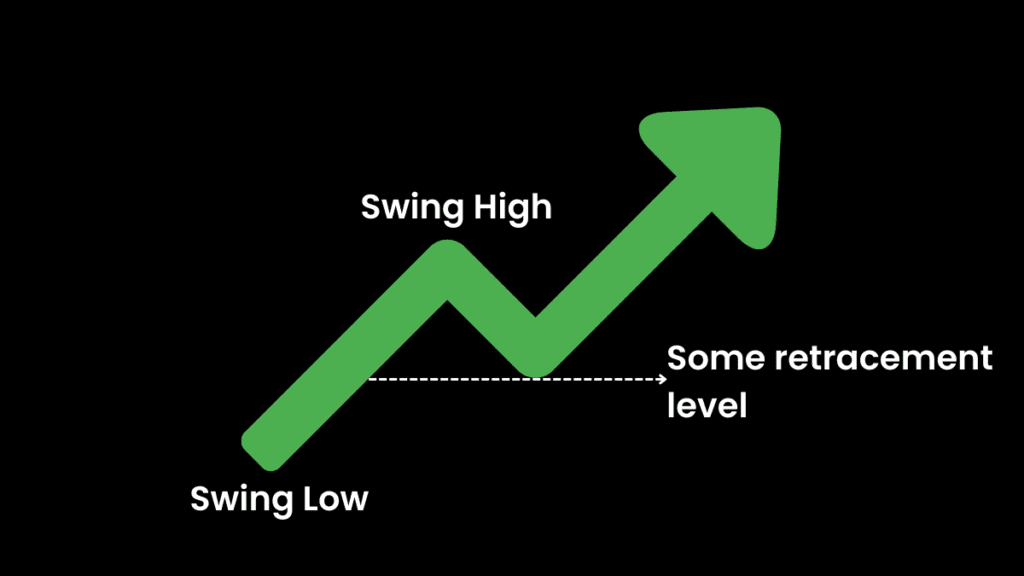
Significance of Fibonacci Retracement levels
The retracement levels can be used to:
• Place entry orders
• Determine stop-loss levels
• Set price targets
For example, A stock may be in an uptrend. After a move up, it retraces to the 61.8% level. Then, it starts to go up again. Since the bounce occurred at a retracement level during an uptrend, you can enter long positions with a stop loss just below the Fibonacci level or at the candlestick low.
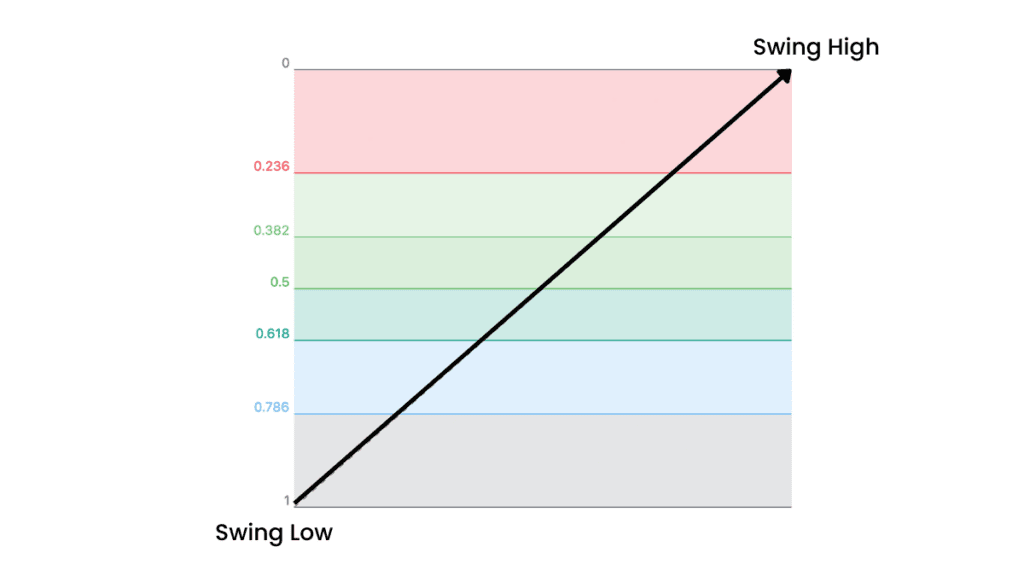
Finding Fibonacci Retracement levels
In order to find the retracement levels, you have to find the recent significant Swing High and Swing Low.
• For uptrends, select the Swing Low and then the Swing High.
• For downtrends, select the Swing High and then the Swing Low.
Exhibit: Fibonacci retracement in an uptrend
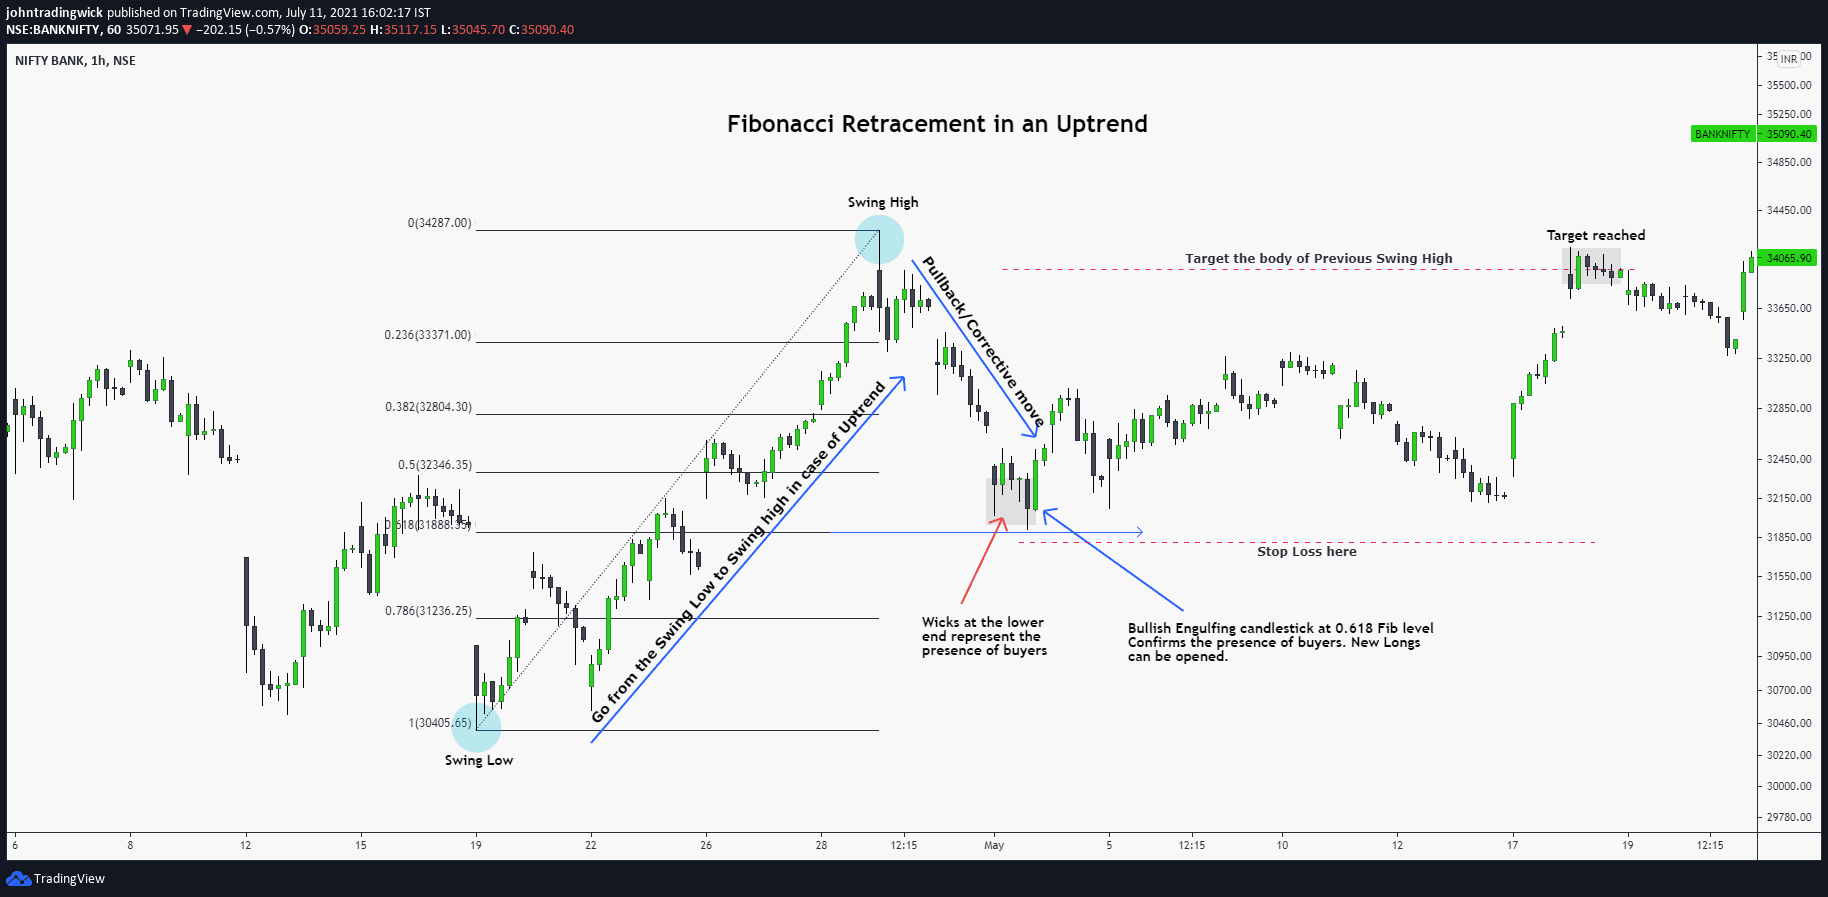
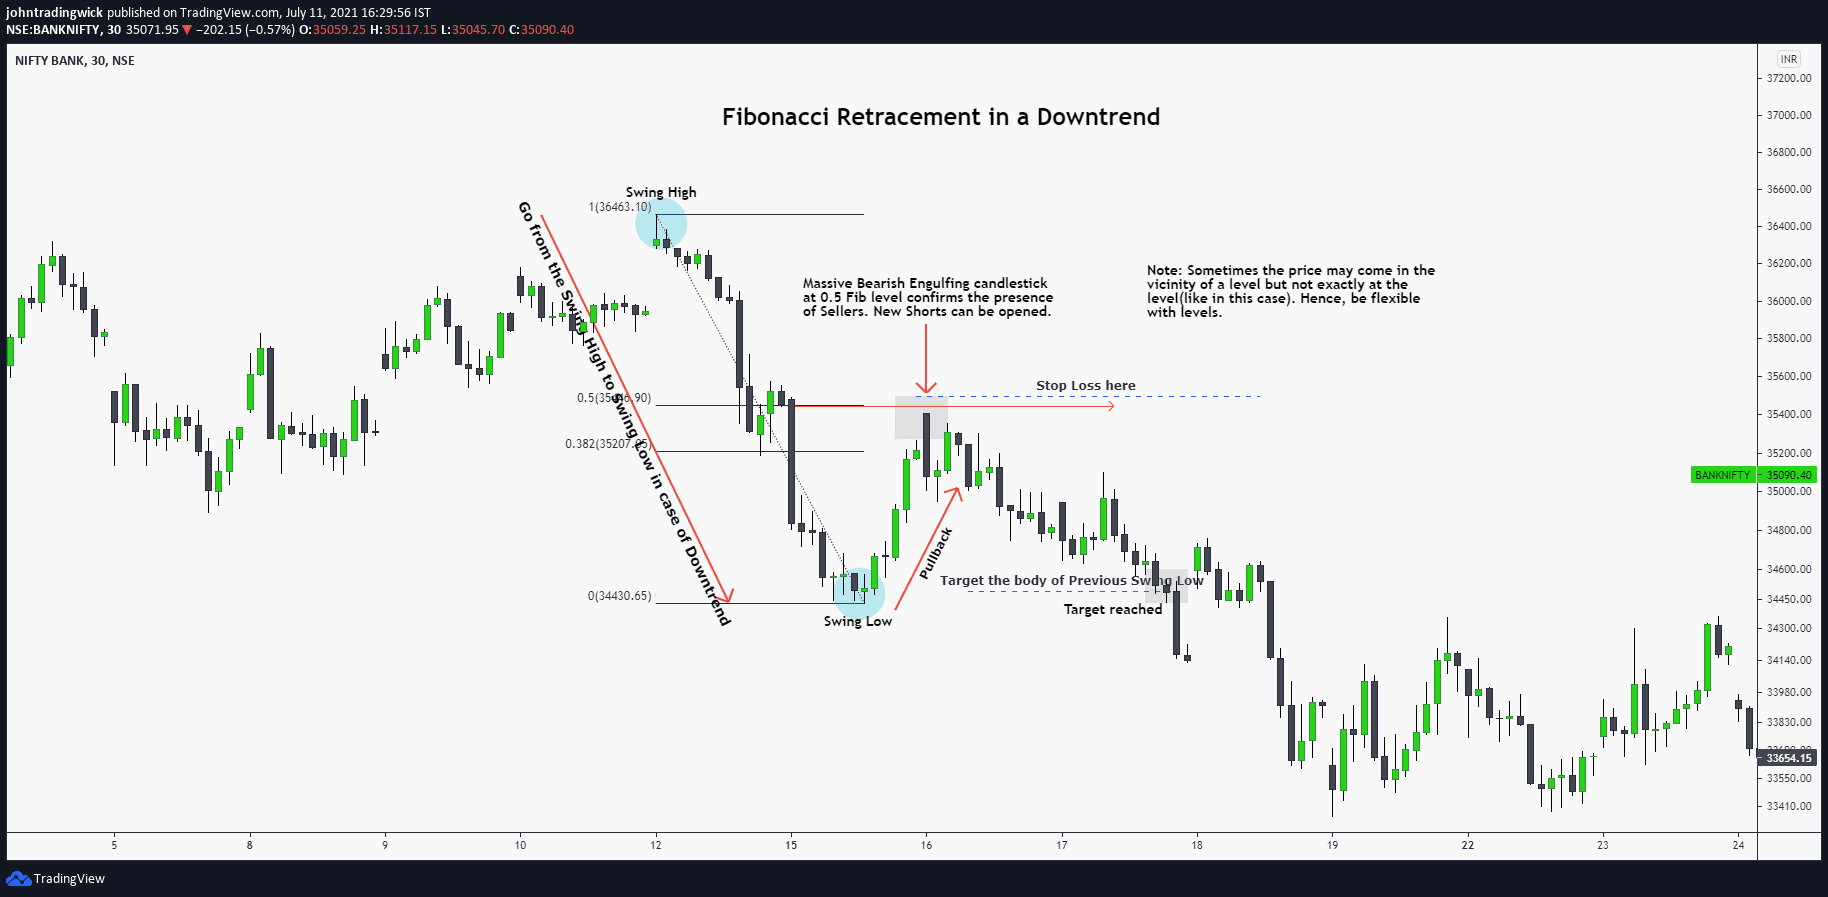
Exhibit: Fibonacci retracement in a downtrend
How to use the retracement levels?
If the price is approaching a Fibonacci level, you should look out for the following things at the point of interaction or in the vicinity of the level.
- Some reversal candlestick pattern
- Volume is above average.
- Moving average
- RSI divergence
- Previous S/R level or pivot level
The trade will be a high probability trade if some of these factors create a confluence zone.
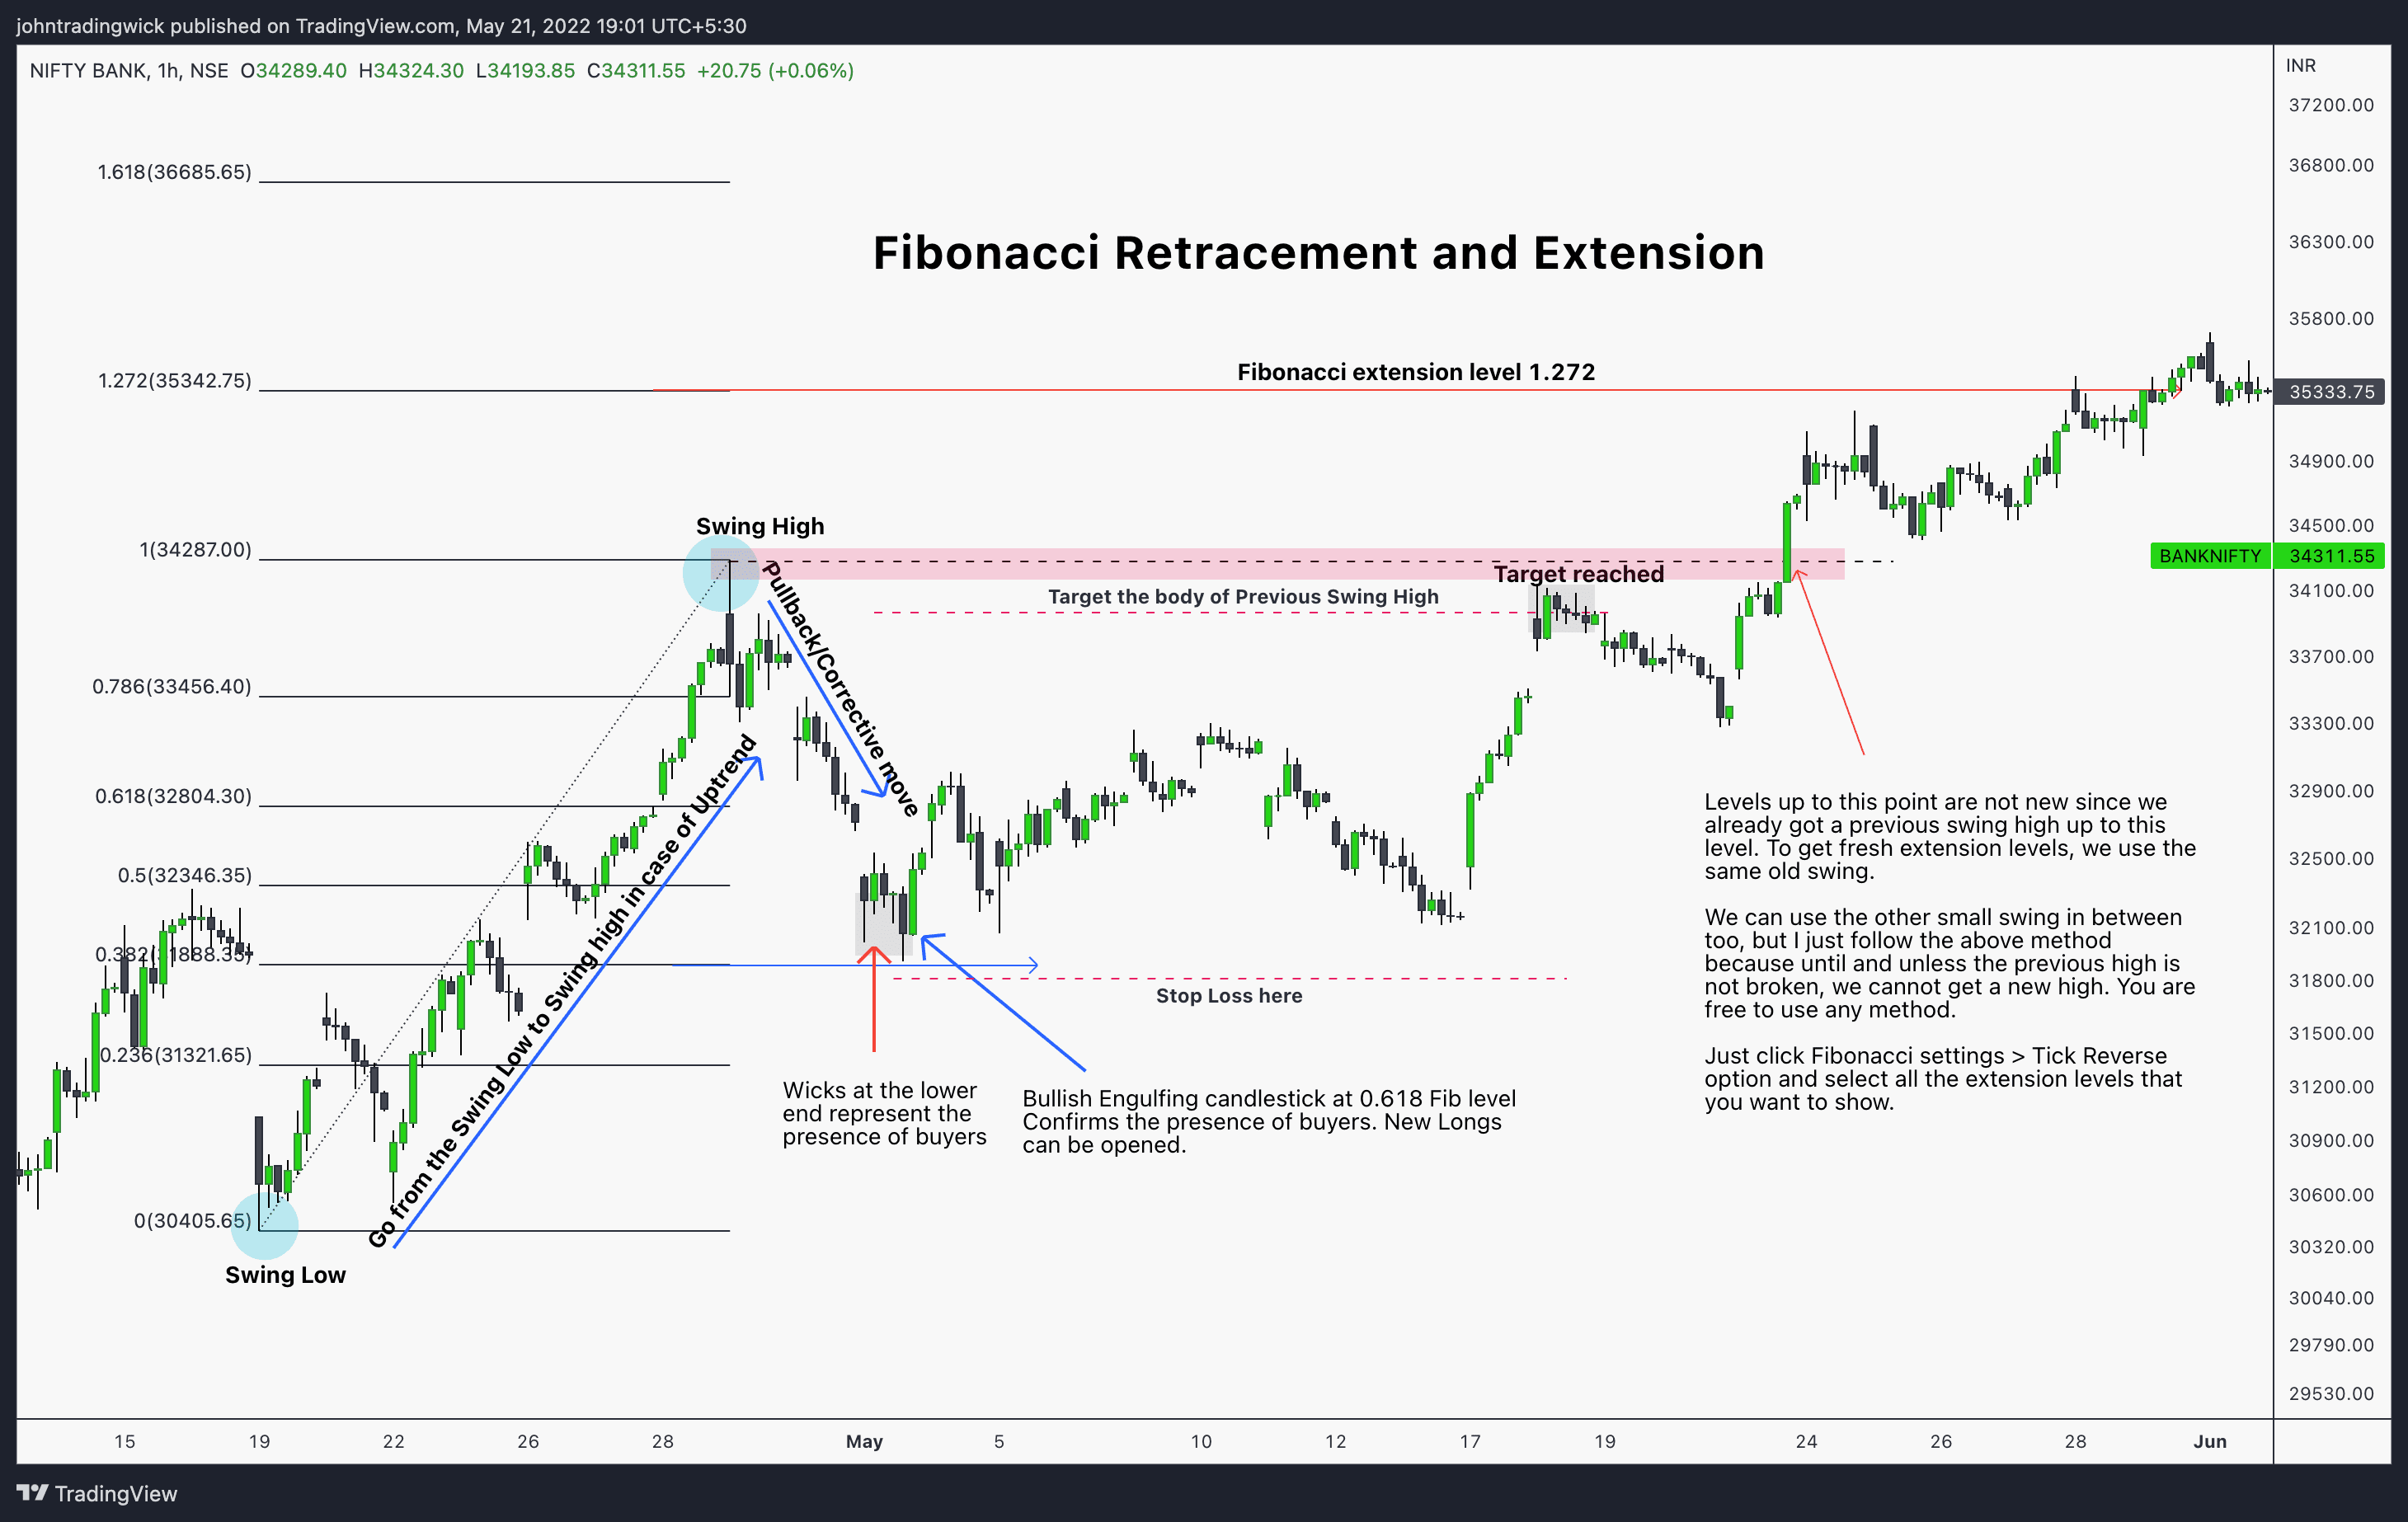
Difference Between Fibonacci retracement and Fibonacci extension levels:
- Fibonacci retracement provide levels for a pullback whereas Fibonacci extensions provide levels to move in the direction of the existing trend.
- For instance, a stock goes from 50 to 100, and then back to 75. The move from 100 to 75 is a retracement. If the price starts rallying again and goes to 150, that is an extension because the price moved past the previous swing high which is 100 in this case.
This is everything you need to know about Fibonacci retracement and extension levels. This thread is more than enough to make you profitable. Keep reading and revising until you learn everything written in this post.
Thanks for reading! Hope this was helpful!
Important links:
- Follow the free Telegram channel for early updates.
- How to see idea statistics on TradingView?
- How to use the TradingView heatmap?