

In this post, we are going to examine bearish divergence and learn about its subtypes along with a few examples.
Last time, I explained some of the basics to know when it comes to understanding bullish divergences in the markets. If you haven’t read that post, be sure to check it out here: What is Bullish divergence?
Please remember this is an educational post to help everyone better understand investing and trading principles. In no way am I trying to promote a particular style of trading.
Table of contents:
1. What is bearish divergence?
2. Types of bearish divergence
3. Some examples
When the price of an asset is moving in the opposite direction of a technical indicator, such as an oscillator, it is called divergence. Divergence warns about potential underlying weakness in the current trend.
What is Bearish divergence?
A bearish divergence occurs when the price rises to a new high while the oscillator fails to reach a new high (exception being hidden bearish divergence). It indicates that the buying pressure is decreasing and the bears may soon take over the market.
Generally, a bearish divergence occurs at the end of an uptrend. It has two sub-types:
– Classic bearish divergence
– Hidden bearish divergence
What is classic bearish divergence?
The classic bearish divergence occurs at the end of a bullish trend and indicates that a trend reversal may occur soon. In this, the price and the oscillator always either form a higher high or an equal high. It can be subdivided into 3 types, based on the strength.
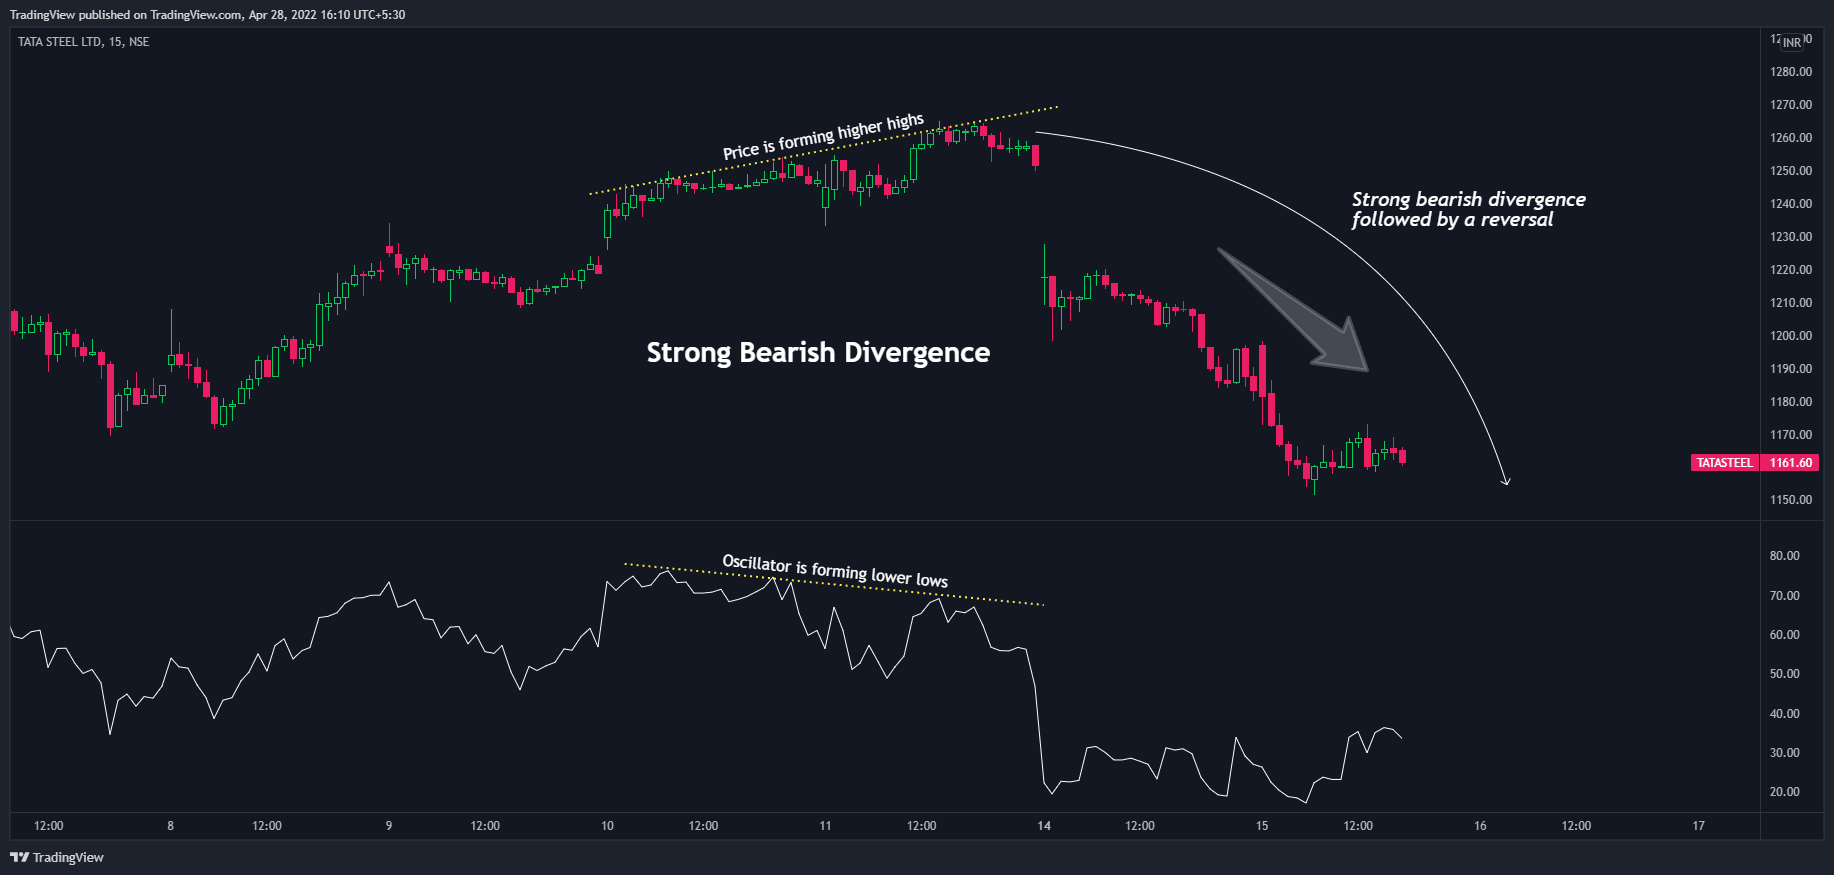
1. Strong Bearish Divergence
In strong bearish divergence, the price forms higher highs but the oscillator forms lower highs. This means that the buyers are not buying at the same momentum i.e. the buying pressure is decreasing.
Price: Higher highs
Oscillator: Lower highs
Exhibit: Strong bearish divergence

Exhibit: Strong bearish divergence followed by a reversal
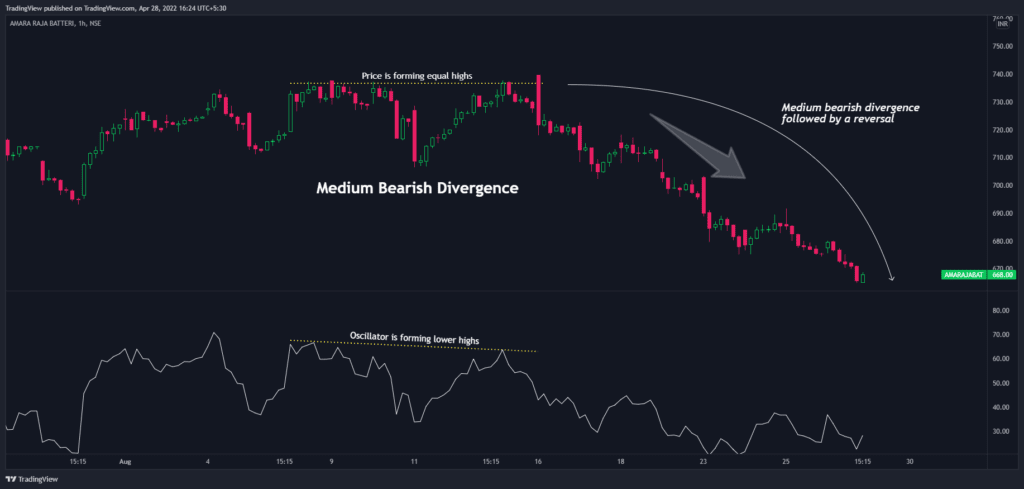
2. Medium Bearish Divergence
The price makes double top (almost the same level as the previous high) and the oscillator makes lower highs. This indicates that at the same price levels, the momentum is decreasing.
Price: Equal highs
Oscillator: Lower highs
Exhibit: Medium bearish divergence
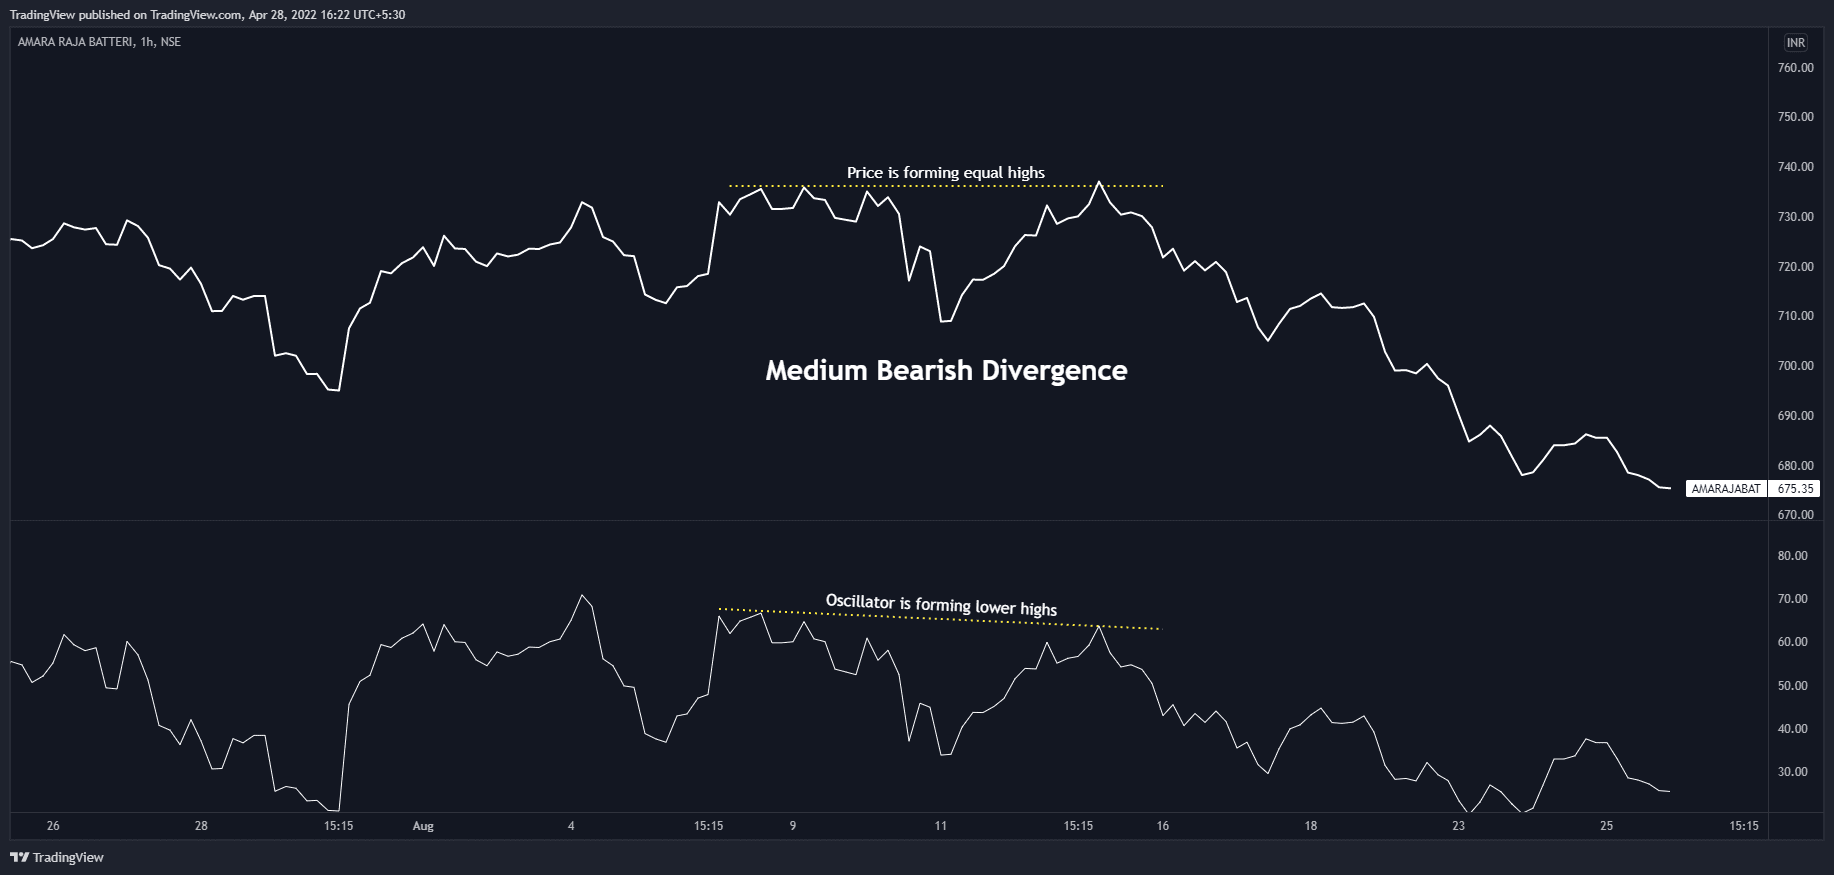
Exhibit: Medium bearish divergence followed by a reversal

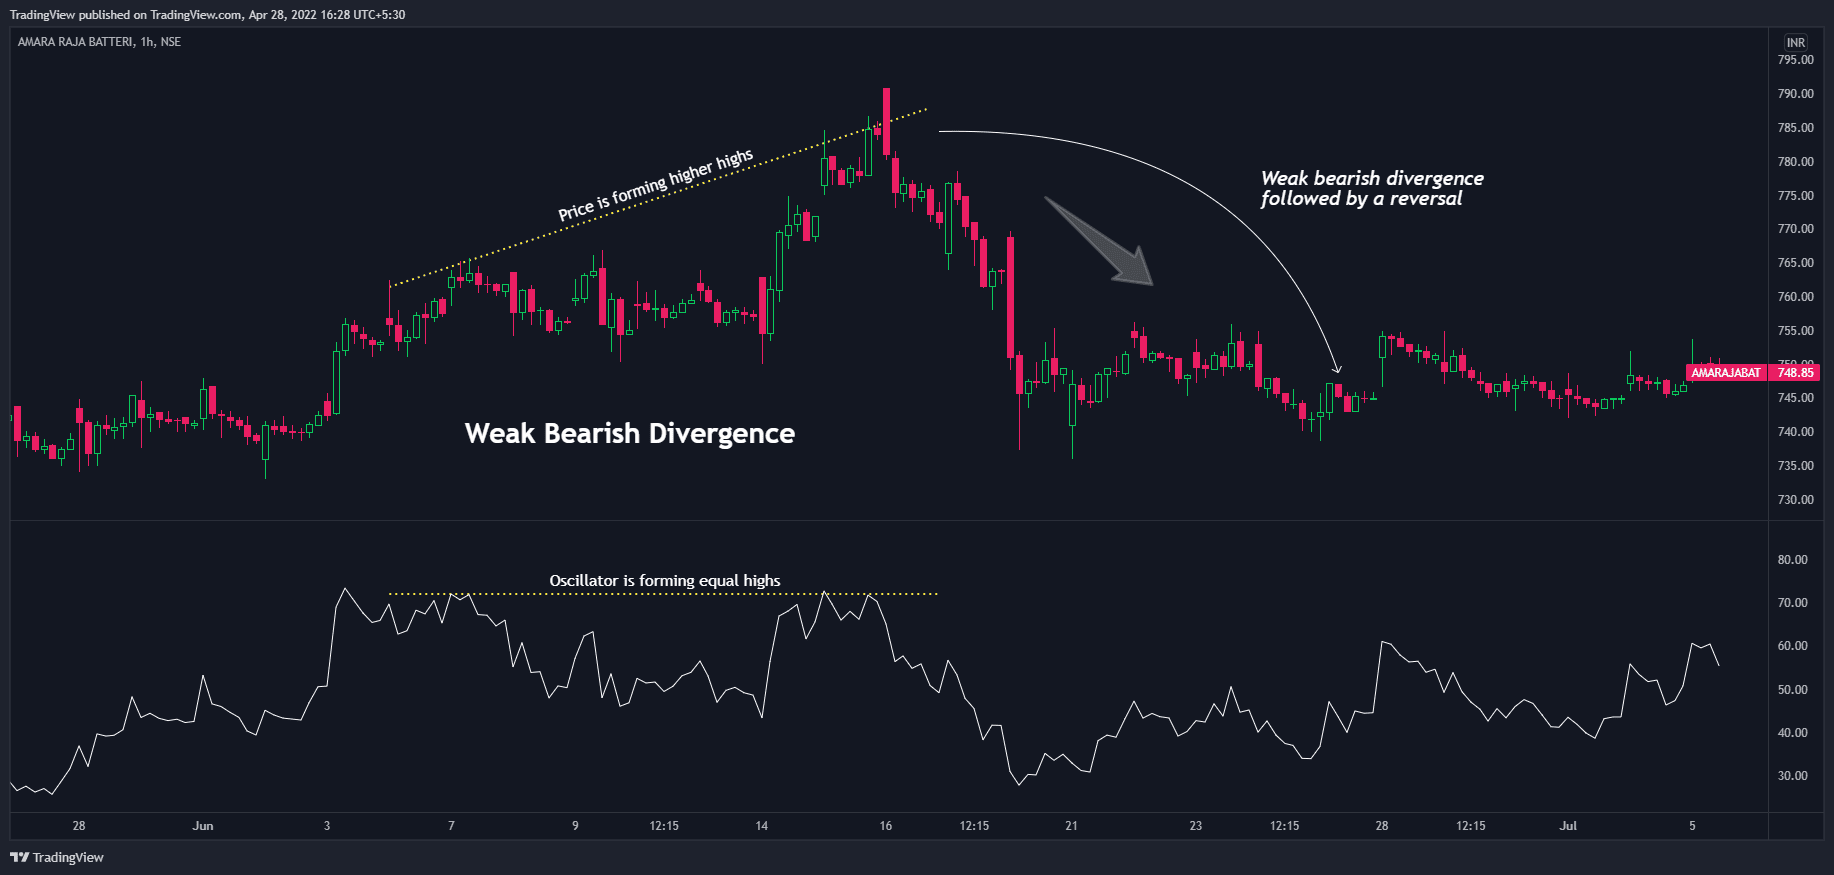
3. Weak Bearish Divergence
In weak bearish divergence, the price makes higher highs but the oscillator has almost the same highs. This means that even though the price is increasing, the momentum is intact.
Price: Higher highs
Oscillator: Equal highs
Exhibit: Weak bearish divergence

Exhibit: Weak bearish divergence followed by a reversal
What is hidden bearish divergence?
The hidden divergence occurs during the correction phase of a trend and is a possible sign of a trend continuation. In this, the price forms lower highs, but the oscillator forms higher highs. This indicates that even at an increased momentum, there is enough selling going on to push the price down. This type of divergence occurs with less frequency as compared to the other types.
Price: Lower highs
Oscillator: Higher highs
Exhibit: Hidden bearish divergence
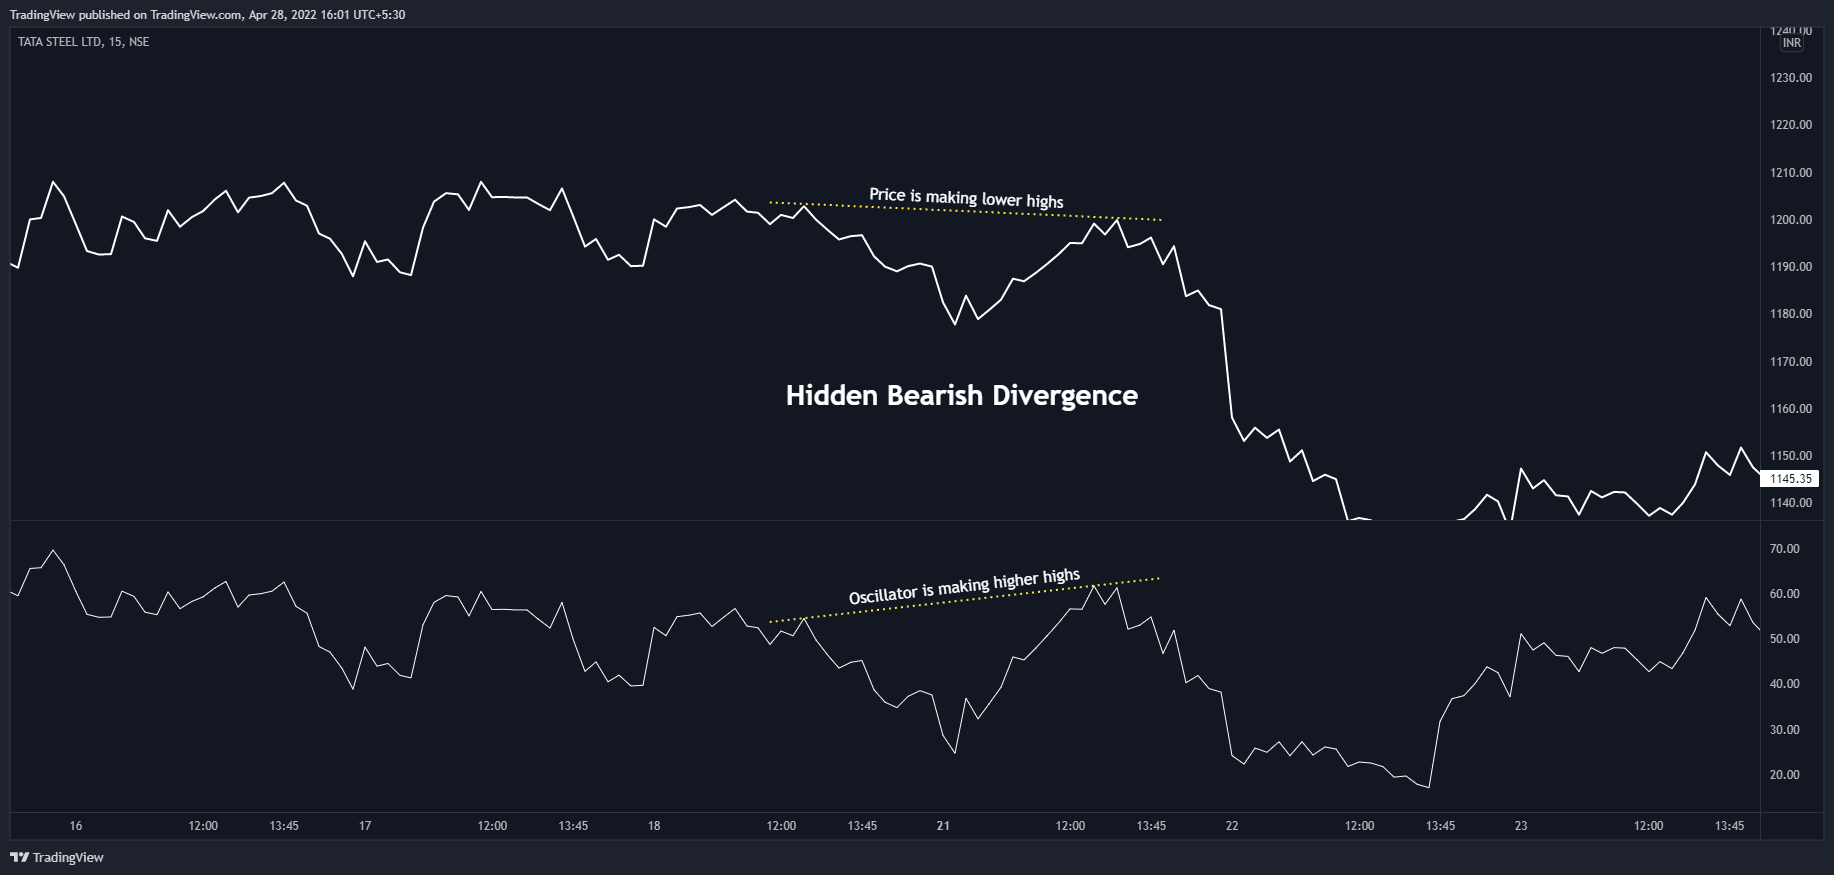
Exhibit: Hidden bearish divergence followed by a reversal

Thanks for reading. Hope this was helpful!
Important links:
- Follow the free Telegram channel for early updates.
- What is Divergence trading?
- What is Bullish divergence?
- How to use the TradingView heatmap?


