


It’s crucial for every trader, regardless of whether they use price action or indicators, to have a solid understanding of market structure. Understanding market structure enables traders to stay in sync with the market and avoid counter-trend trading, which, in turn, increases the probability of successful trading setups.
In this post, I will delve into bearish market structure, providing clear illustrations and examples to help you grasp this important concept. If you aren’t familiar with market structure, you can go through this guide to brush up on your basics.
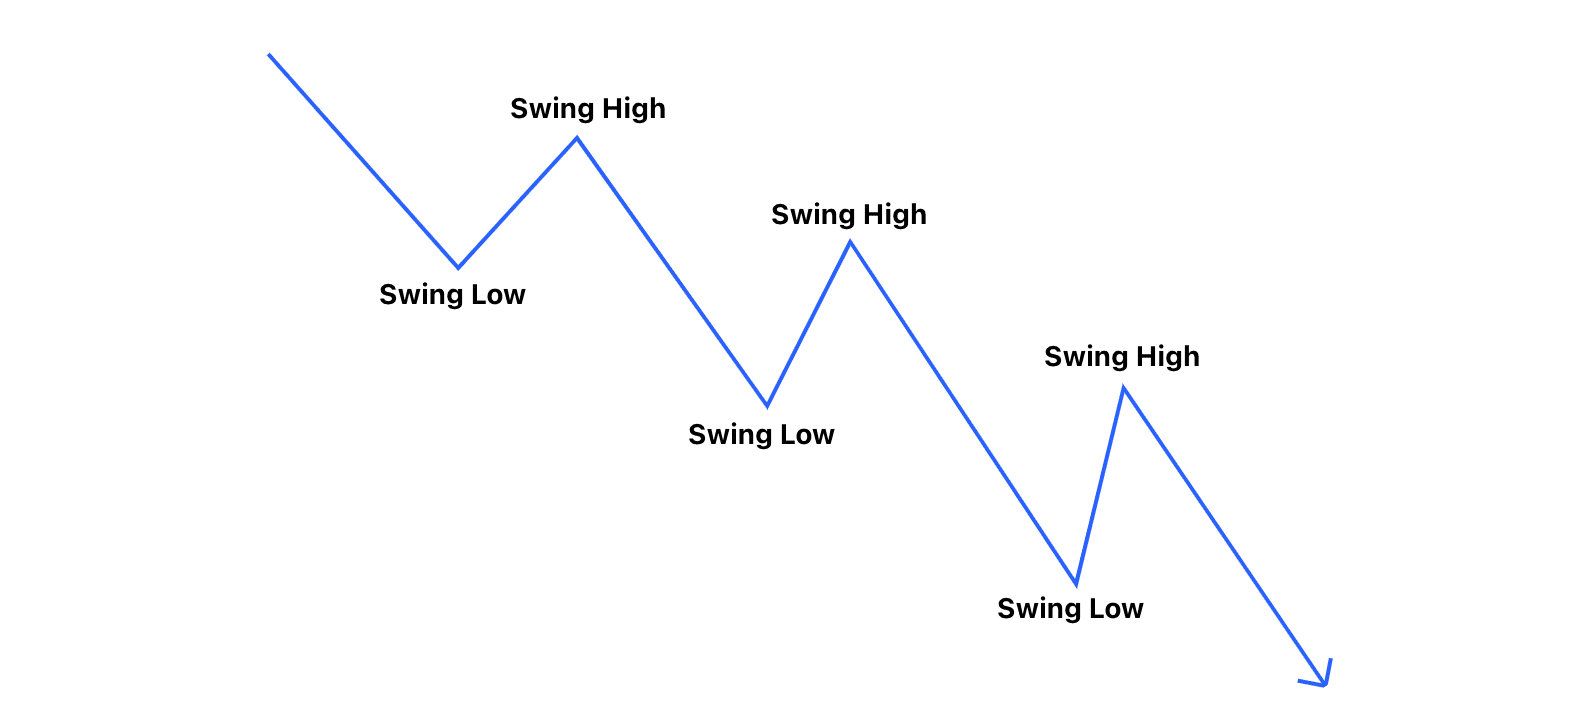
To understand a bearish market structure, it’s essential to familiarize ourselves with a bearish trend or downtrend. This will provide us with the necessary context to recognize the characteristics of a bearish market structure
What is a downtrend?
✅ A bearish trend is characterised by a bearish market structure.
✅ The downtrend contains a series of lower highs followed by lower lows.
✅ For a downtrend to stay intact, it must preserve its descending structure – lower highs must follow lower lows.
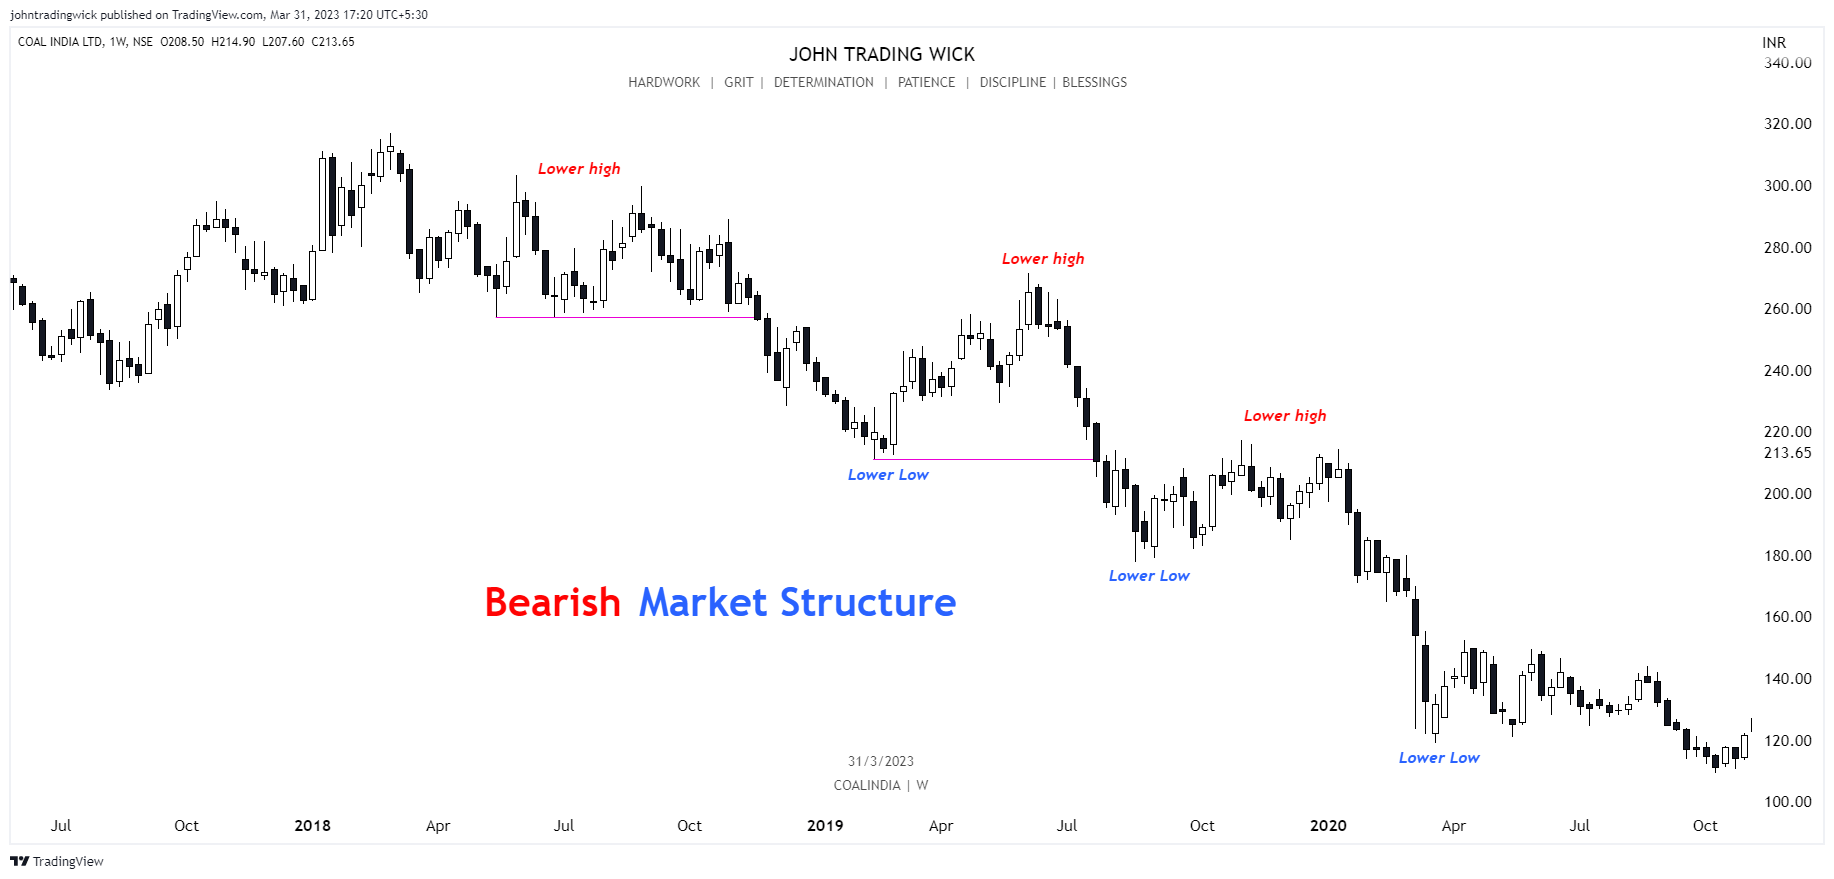
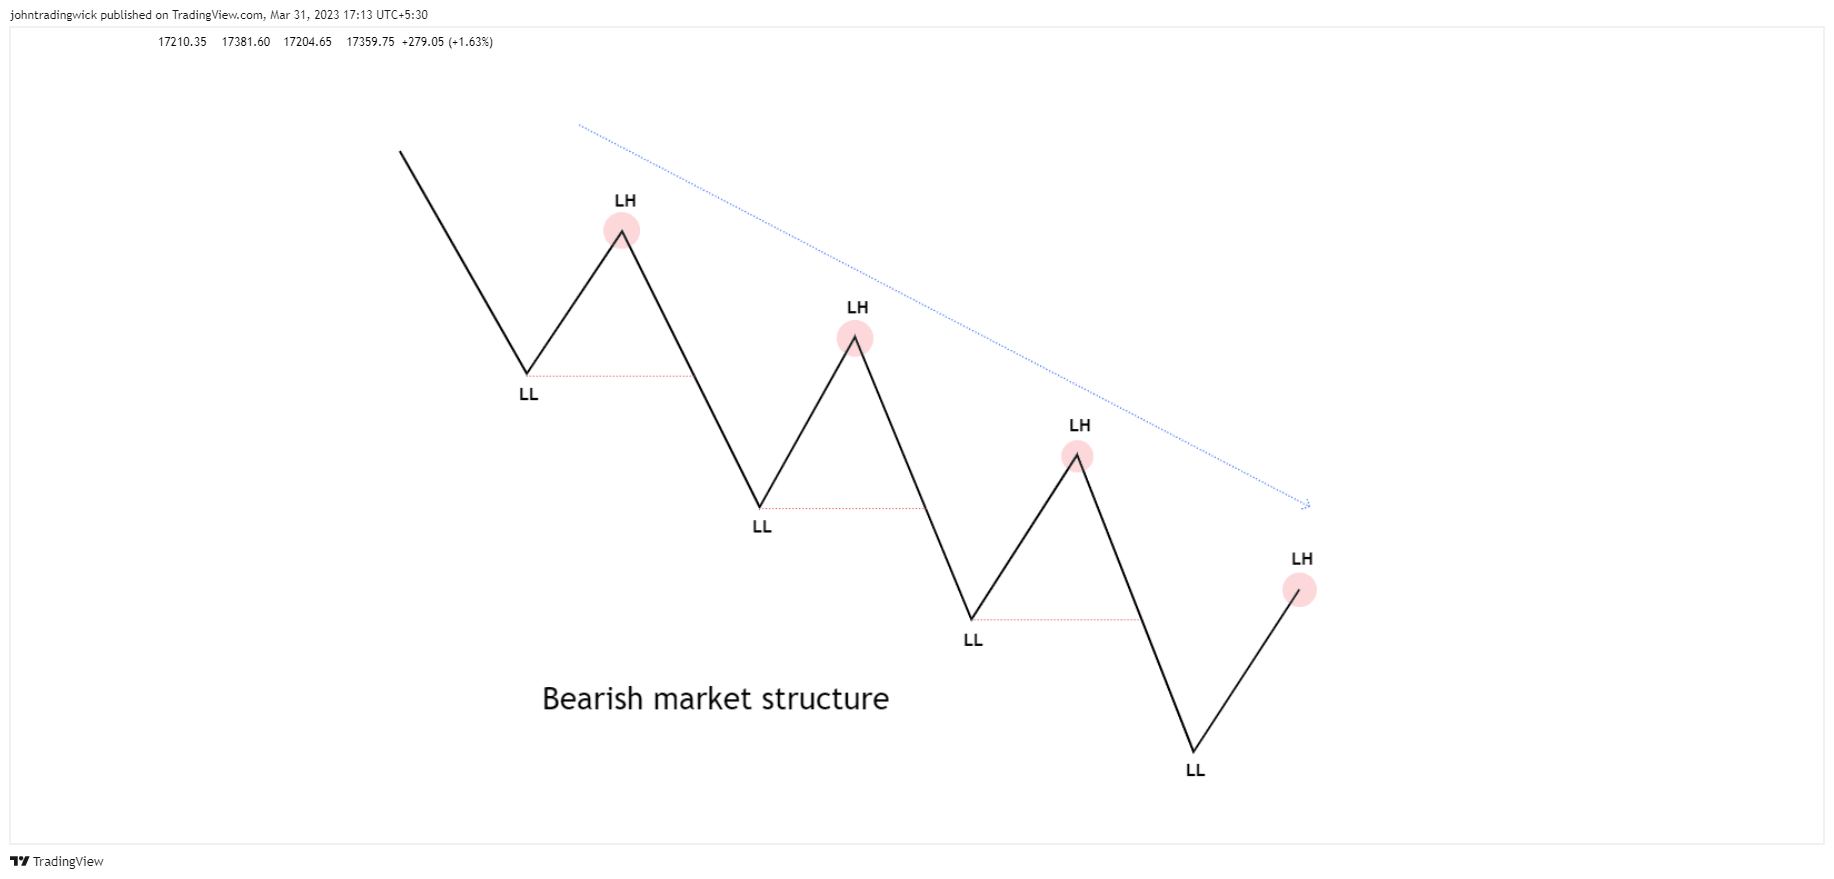
What is a Bearish market structure?
A bearish market structure is characterized by a series of consecutive lower highs and lower lows. Simply put, when the price is consistently making lower lows and lower highs, it indicates the formation of a bearish market structure.
What is the use of identifying a bearish market structure?
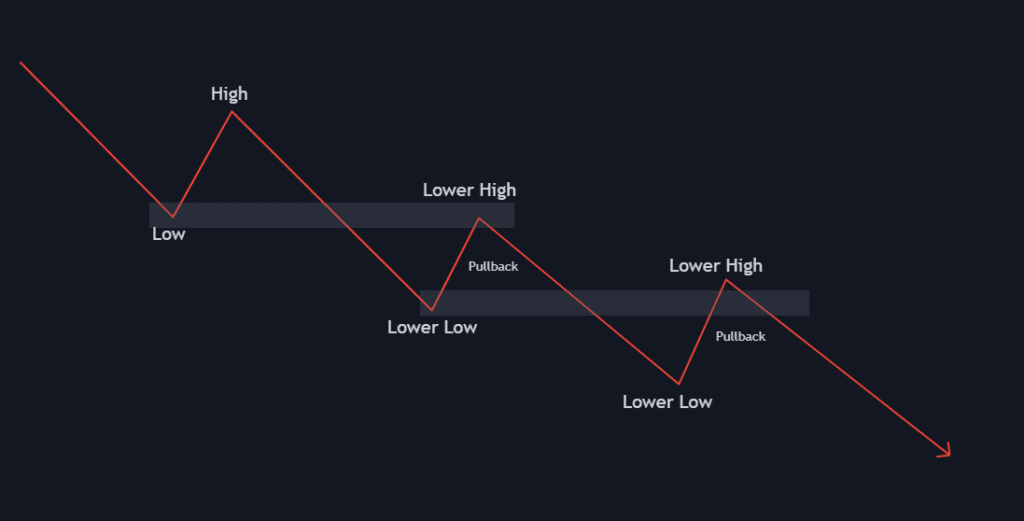
Identifying any market structure plays a crucial role in entry and exit. In the case of a bearish market structure, previous lows often act as resistance zones where traders can enter new short positions with the expectation of further downward movement. When the price approaches or revisits the previous low, it’s commonly regarded as a selling opportunity, often referred to as “selling the rip.“
Exhibit: Pullback in a Bearish market structure
What happens when there is a “Possible” change in Bearish structure?
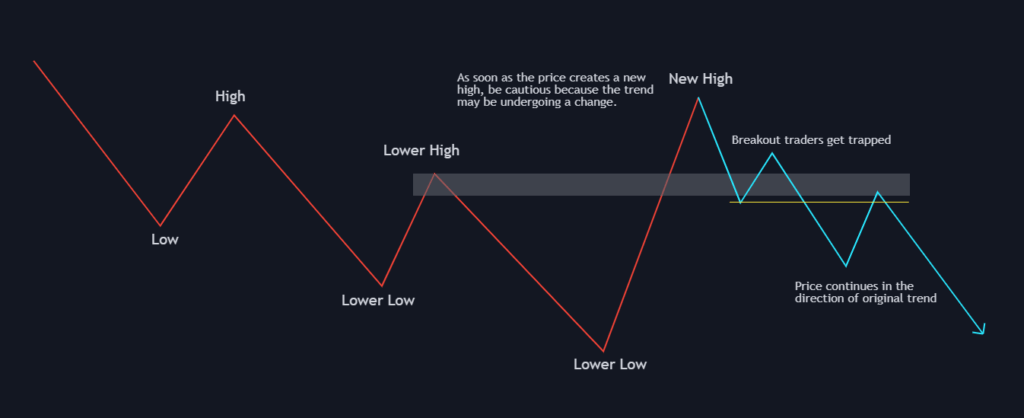
When a stock is in a bearish trend, and the price suddenly prints a new high, traders must exercise caution because it could signal a potential trend change. However, it’s also possible that the stock may consolidate before resuming its original downward trend, or it may be a false signal known as a “bull trap.”
If the trend change is confirmed, the trader may consider exiting short positions and look for long trades instead. By being aware of these potential scenarios, traders can avoid costly mistakes.


Possible scenarios after the formation of a “New High”:
- Trend reversal
- Consolidation followed by a continuation of the bearish trend
- Bull trap
Trend Reversal
The first clear-cut scenario is a genuine trend reversal. After the formation of a new high, a new higher low is formed, eventually leading to the creation of a new uptrend. This scenario can be identified by a sustained upward movement in price, indicating a shift from a bearish to a bullish trend.


Consolidation and Continuation
In this scenario, after a “new high” is created, the price begins to consolidate below it. It’s important to note that the price never moves above the “new high” and ultimately falls, continuing the bearish trend. Traders should be cautious of this type of consolidation as it can potentially signal a trend reversal, but as long as the price remains below the “new high,” the bearish trend is likely to continue.

Bull Trap
A bull trap occurs when the price of an asset appears to be breaking above a previous resistance level, but then suddenly reverses direction and falls back lower. This “breakout” entices traders to enter long positions, believing that a breakout has occurred. However, the market reverses and ultimately moves in the opposite direction, trapping these traders.
These three scenarios are the only market structures that can form within a bearish trend, and they will continue to occur repeatedly. Therefore, it’s important to have a good grasp of these concepts as they are applicable to all timeframes.
That’s all you need to know about bearish market structure. To reinforce your understanding, try applying these concepts to a random chart and backtest them. With practice, you’ll gain more experience and become more adept at identifying these structures.
Whether you use a specific trading strategy or not, having a solid understanding of market structure will enhance your confidence in your trades and ultimately lead to more successful outcomes. So, keep practising and refining your skills, and you’ll be on your way to becoming a more successful trader.
Like this article? Don’t forget to share it! Follow me on Twitter and YouTube for more educational content.
thanks, interesting read