


Bollinger Bands are a widely used technical analysis tool traders rely on to gauge market volatility and identify potential entry and exit points. Developed by John Bollinger in the 1980s, they provide a simple yet effective method to analyze price trends and determine potential movements.
In this post, we’ll cover the fundamental concepts of Bollinger Bands, including how they work and how you can use them to your advantage. This post will also lay the groundwork for future posts about more advanced topics on Bollinger Bands.
What are Bollinger Bands?
Bollinger Bands are composed of three lines that are plotted on a price chart. The first line is a simple moving average (also known as the basis line), and the other two lines are standard deviation lines, one located above the SMA and the other below it.
When plotted, the SMA appears at the centre of the chart, flanked by the upper and lower bands. The width of the bands is determined by market volatility; the bands will expand as volatility increases and contract as volatility decreases
Components of Bollinger Bands
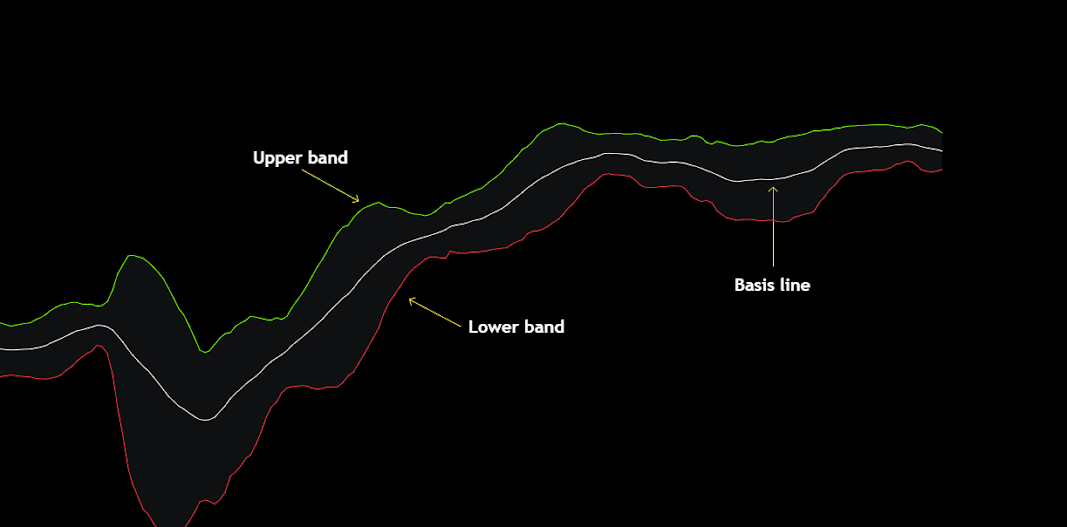
Basis line: The basis line is the middle line in the Bollinger Bands and represents the simple moving average (SMA) of the closing prices of an asset over a defined period.
Upper Band: The upper band is calculated by adding a specified number of standard deviations to the SMA. Typically, traders use two standard deviations from the SMA, making it the most common setting used. However, these settings are not universal and vary as per the trading style.
Lower Band: The lower band is calculated by subtracting the same number of standard deviations from the SMA. This results in a channel of three lines, with the upper and lower bands fluctuating around the SMA, reflecting volatility.
Different Interpretations of Bollinger Bands:
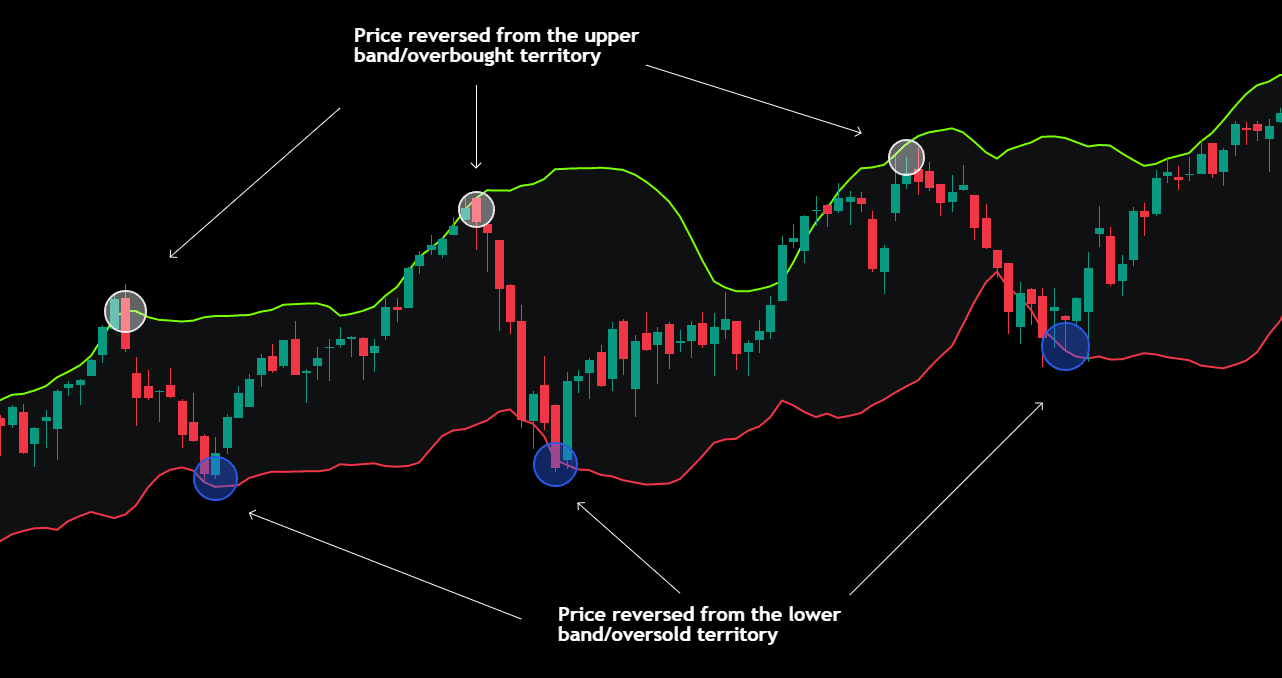
Overbought and Oversold Conditions
Bollinger Bands can help in the identification of overbought and oversold conditions. Generally, when the price of an asset touches or exceeds the upper band, it may suggest that the asset is overbought, and a pullback or reversal could be on the horizon.
In contrast, when the price touches or falls below the lower band, it may indicate that the asset is oversold and could be due for a bounce or reversal.
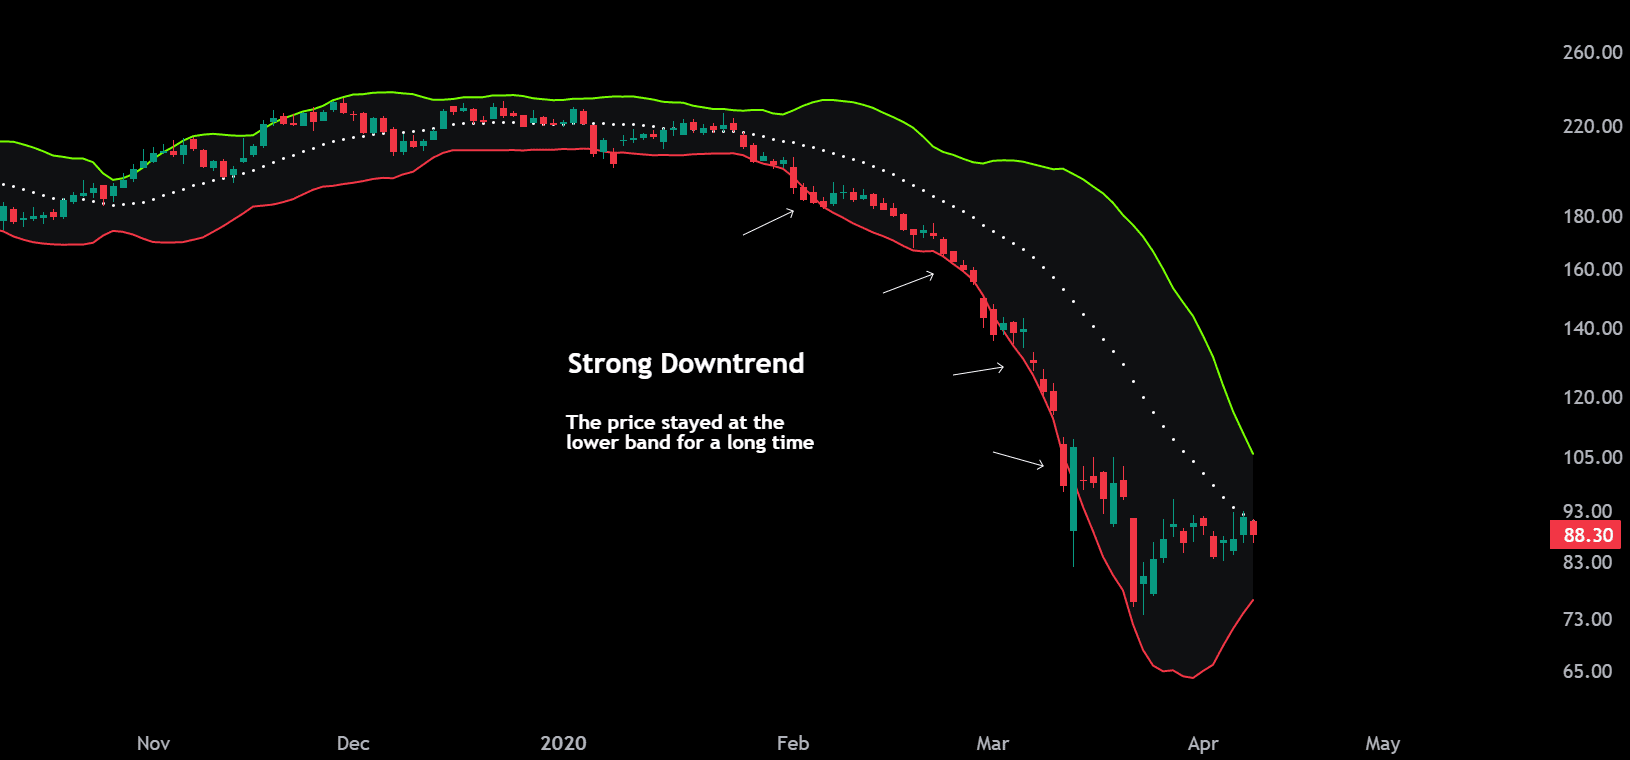
However, it’s worth noting that in strong trends, the price may remain at the upper or lower band for an extended period. This occurrence is not a signal for a pullback or reversal, and traders should consider other factors to confirm the actual trend.
Exhibit: Strong Uptrend
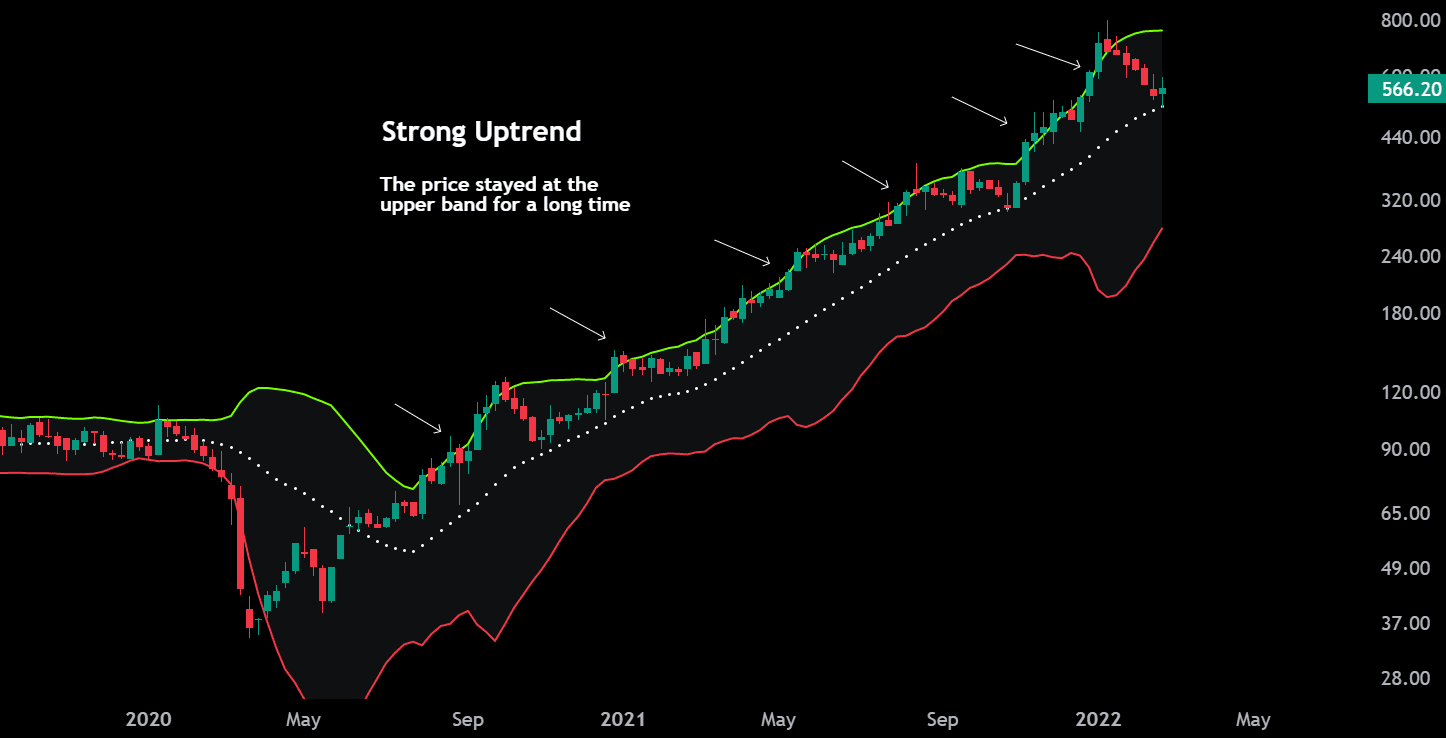
Exhibit: Strong Downtrend
Volatility Indicator
Bollinger Bands serve as a measure of volatility. As the bands widen, it indicates that the volatility is increasing, which means that price swings are likely to be more significant. Conversely, when the bands become narrower, it suggests that the volatility is decreasing, which could result in smaller price fluctuations.
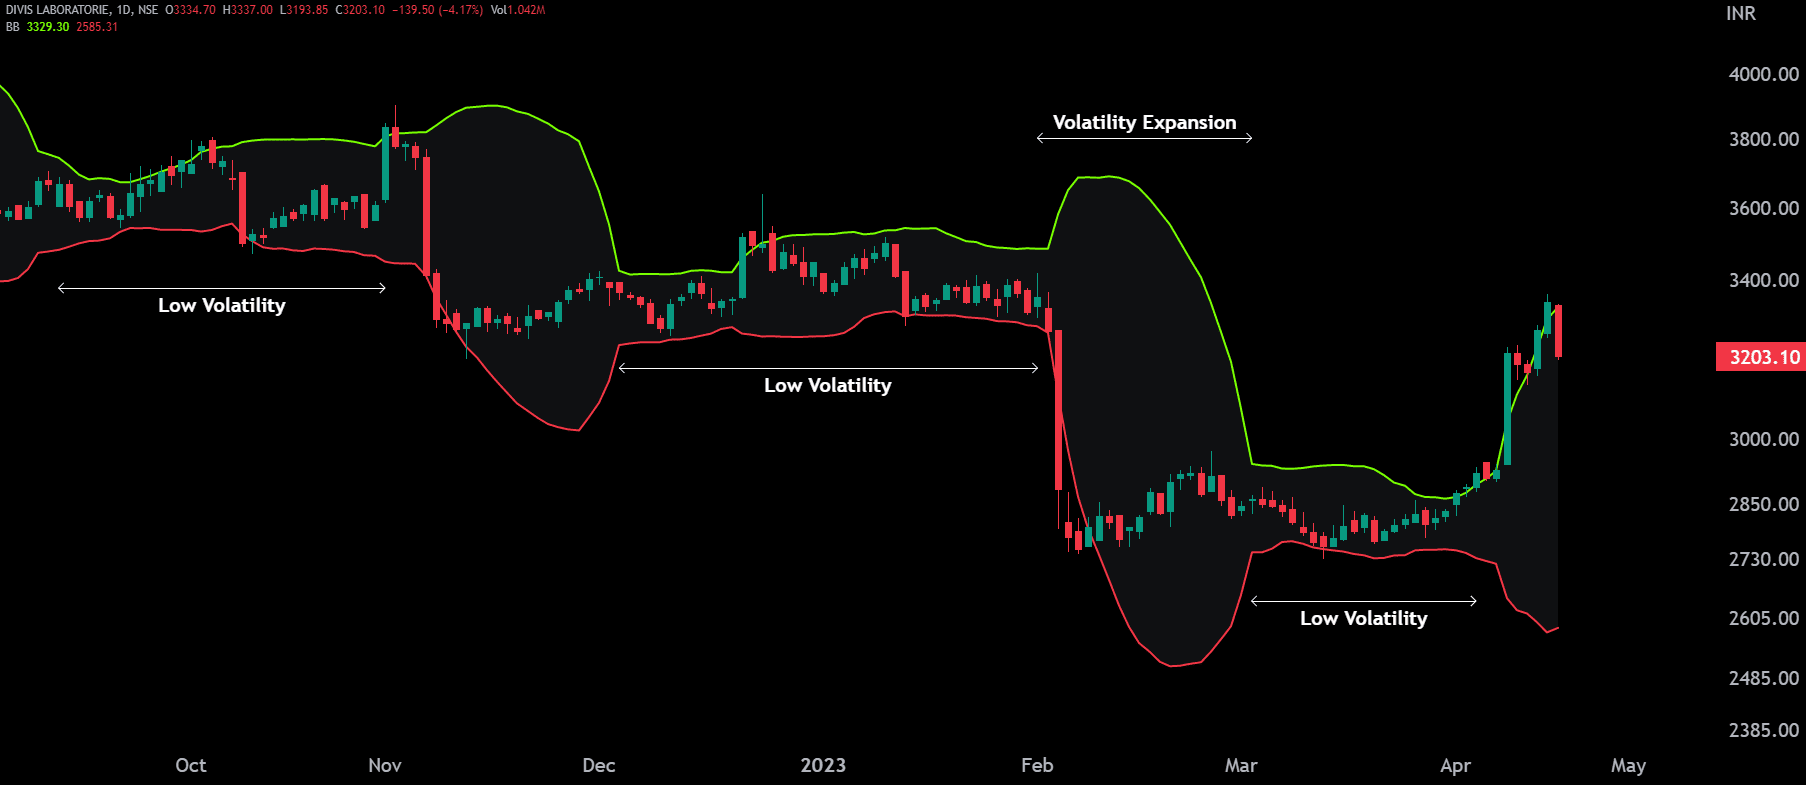
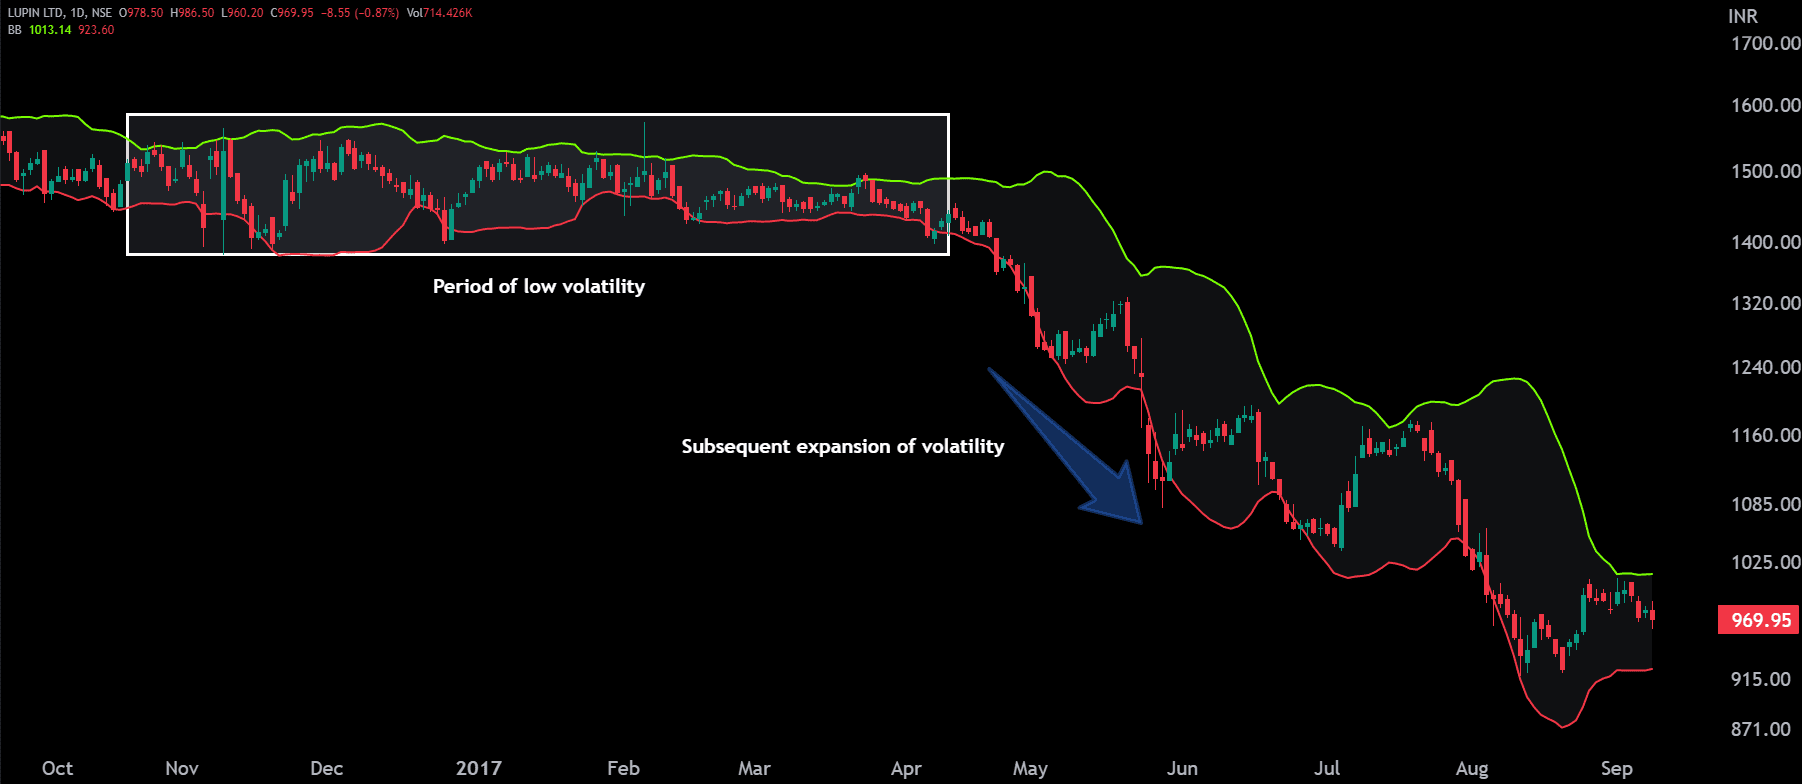
Bollinger Band Squeeze
A squeeze occurs when the bands contract and move closer together, indicating decreased market volatility. This phenomenon is often a precursor to a significant price movement or breakout, as periods of low volatility often precede periods of high volatility in the market.
Trend Confirmation
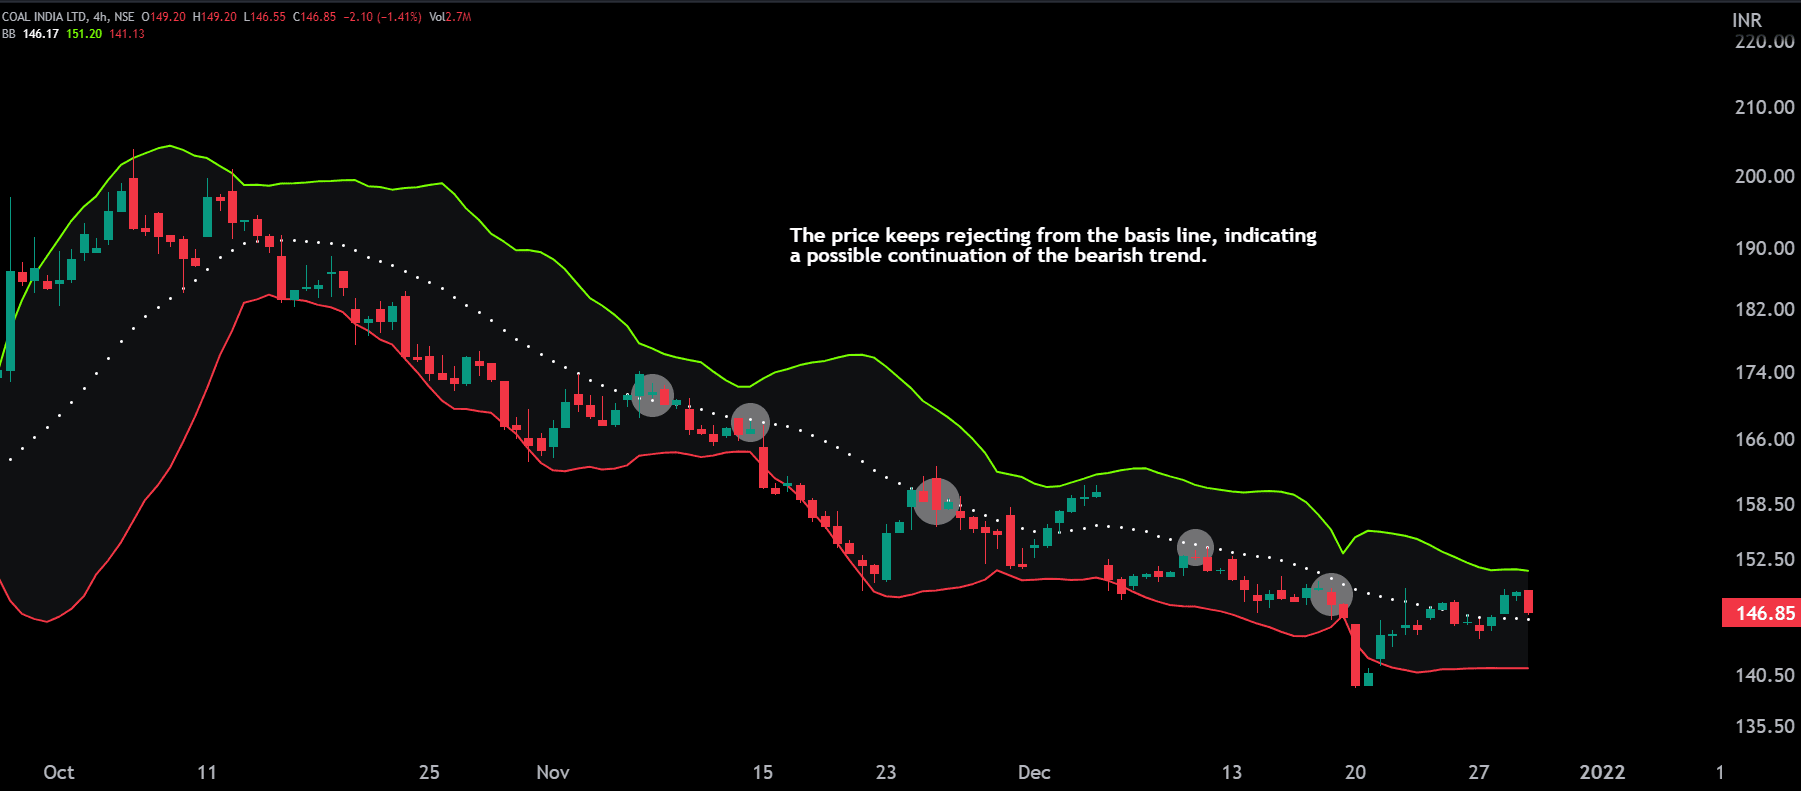
Bollinger Bands can also be used to confirm the direction of a trend. During an uptrend, prices often stay within the upper half of the Bollinger Bands, while in a downtrend, prices tend to remain in the lower half of the bands.
In addition, when prices repeatedly bounce off the basis line or keep getting rejected from it, it could indicate the continuation of a trend.
Exhibit: Trend continuation in a Bullish trend
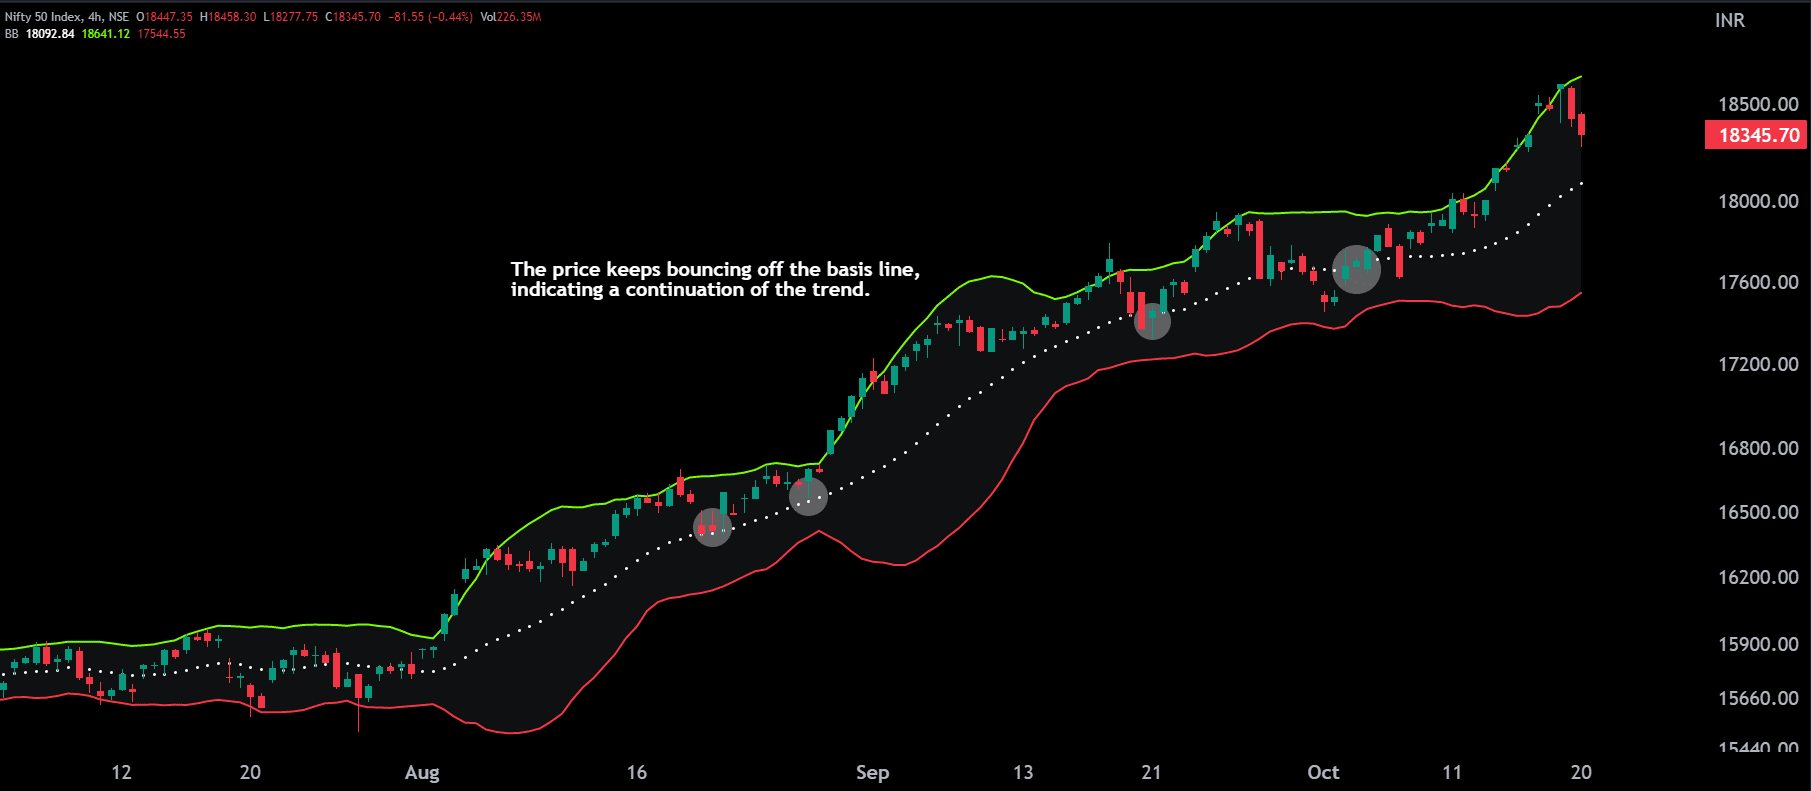
Exhibit: Trend continuation in a Bearish trend
Like this article? Don’t forget to share it with your friends! Follow me on Twitter and YouTube for more educational content.