If you are a beginner or an amateur, you may have wondered through these question a lot of times – “How do you identify a successful stock breakout? What’s going on background when a breakout occurs? What can be the different of breakouts?”
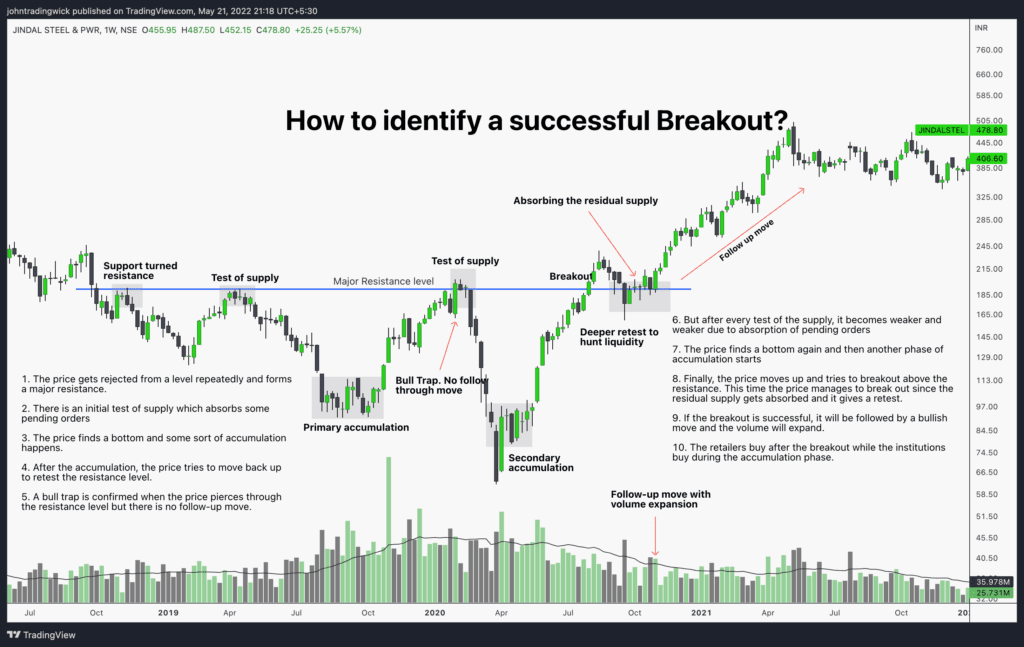
In this post, I’ll try to touch upon these questions. Consider the chart below:

Underlying logic behind the above stock breakout:
1. The price gets rejected from a level repeatedly and forms a major resistance.
2. There is an initial test of supply which absorbs some pending orders
3. The price finds a bottom and some sort of accumulation happens.
4. After the accumulation, the price tries to move back up to retest the resistance level .
5. A bull trap is confirmed when the price pierces through the resistance level but there is no follow-up move.
6. But after every test of the supply, it becomes weaker and weaker due to absorption of pending orders (already discussed in older posts).
7. The price finds a bottom again and then another phase of accumulation starts
8. Finally, the price moves up and tries to breakout above the resistance. This time the price manages to break out since the residual supply gets absorbed and it gives a retest.
9. If the breakout is successful, it will be followed by a bullish move and the volume will expand.
10. The retailers buy after the breakout while the institutions buy during the accumulation phase.
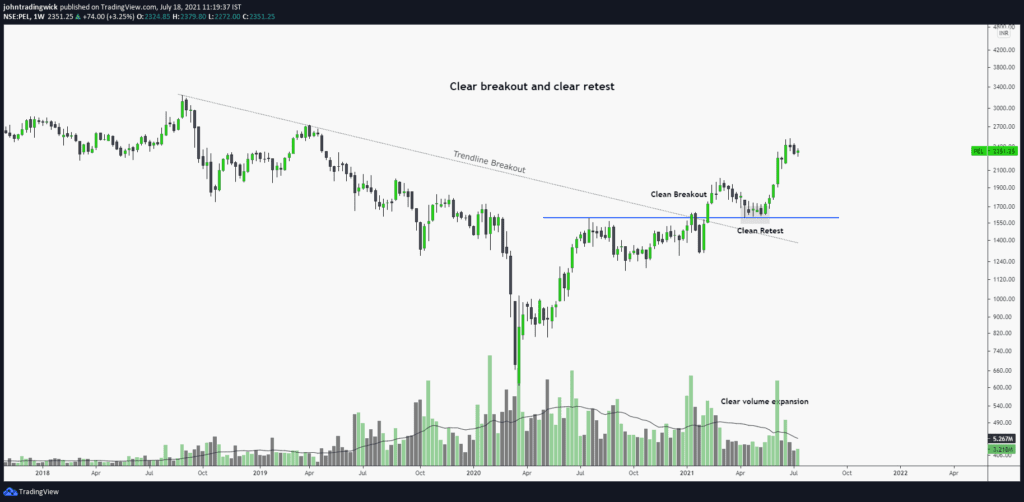
Type 1: Clear stock breakout and clear retest

Sometimes, a stock will give a breakout and a retest just after that. This case one of the easiest to trade since we always anticipate a retest of the previous important horizontal levels. As soon as the price returns to one of these levels, we look for signs of reversal, and enter the trade accordingly.
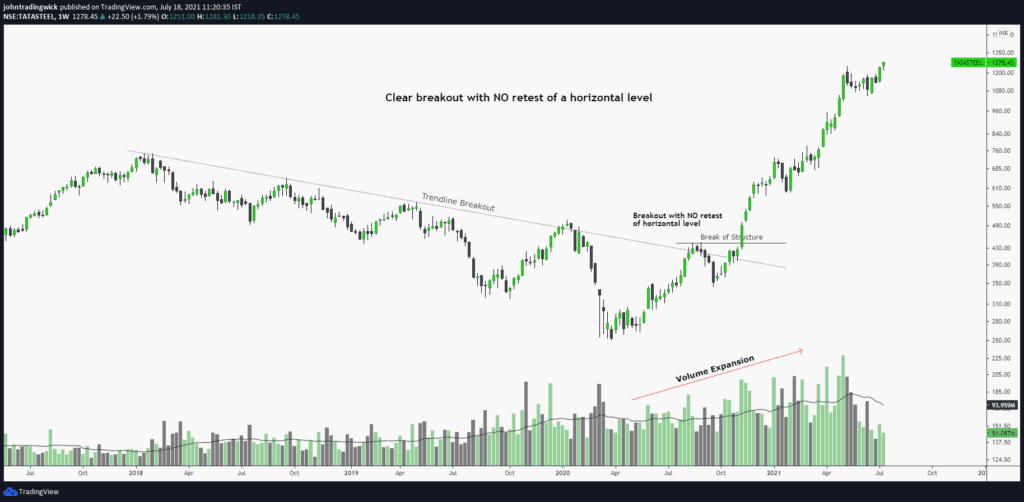
Type 2: Clear breakout with no retest of a horizontal level

A lot of times the stock doesn’t give a retest of previous important levels. This is mainly the case when the trend is too strong and the buyers are way too aggressive. The stock will keep rallying until the momentum slows down, but by that time, it may be too late to open fresh positions. It’s always better to wait on the sideline in such cases.
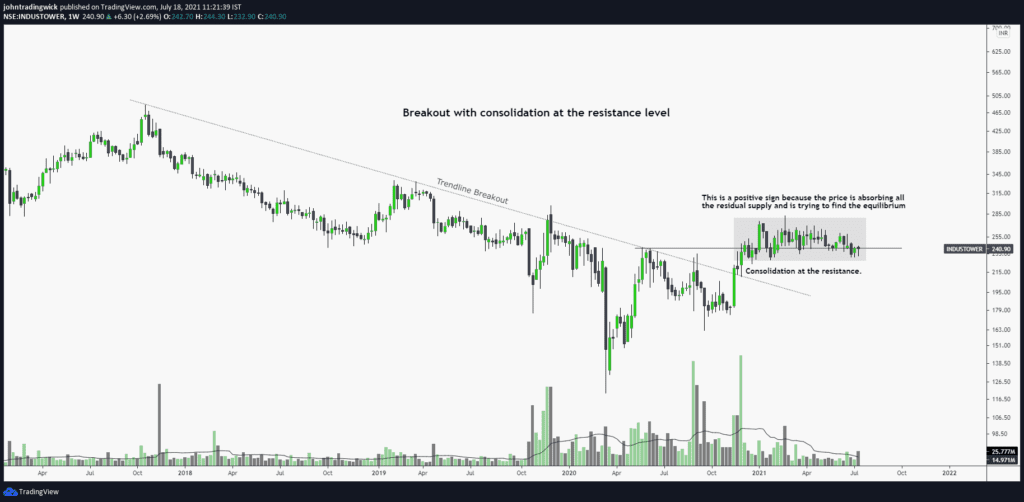
Type 3: Breakout with consolidation at the resistance level

Sometimes, the price may start consolidating at the resistance level. This is a positive sign because the price is absorbing all the residual supply and is trying to find the equilibrium.
There can be many different variations, but the underlying concepts remain the same. If you still have some doubts, you can watch this video for a better understanding.
Important links:
- Follow the free Telegram channel for early updates.
- What is Fibonacci retracement?


