


The rounding top, also known as a saucer top, is a bearish reversal pattern that typically emerges at the end of an uptrend. The formation of a rounding top indicates that buying pressure is gradually being replaced by selling pressure, ultimately leading to a reversal in the trend.
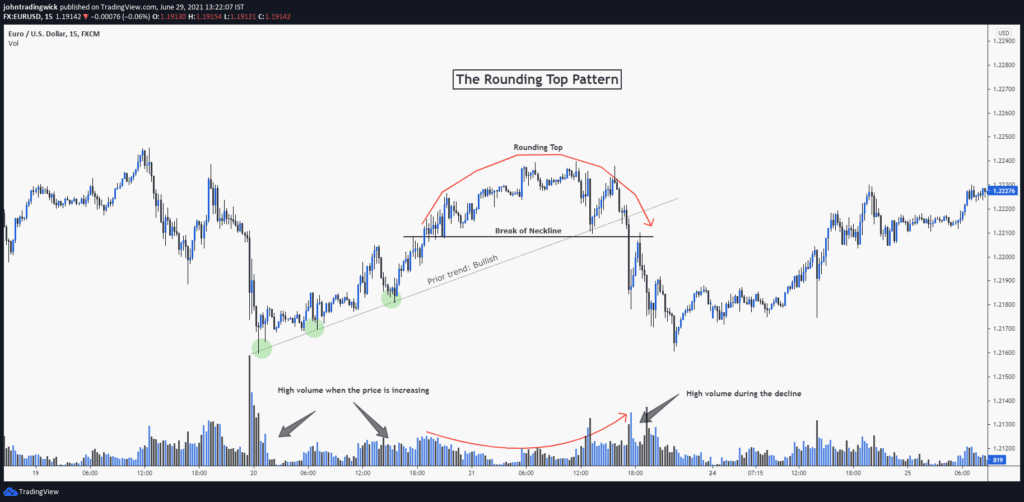
The pattern is characterized by a gradual upward slope followed by a rounded peak and a gradual downward slope. It is formed when the price fails to break through the resistance level at the rounded peak and instead begins to decline, as buyers’ enthusiasm wanes and sellers begin to take control. This shift is often accompanied by a decrease in trading volume, which is a further indication of weakening demand and a potential reversal.
The aim of this post is to provide insights into the following topics:
➡ Basics and identification of the pattern
➡ Components
➡ Important aspects
What is a Rounding Top?
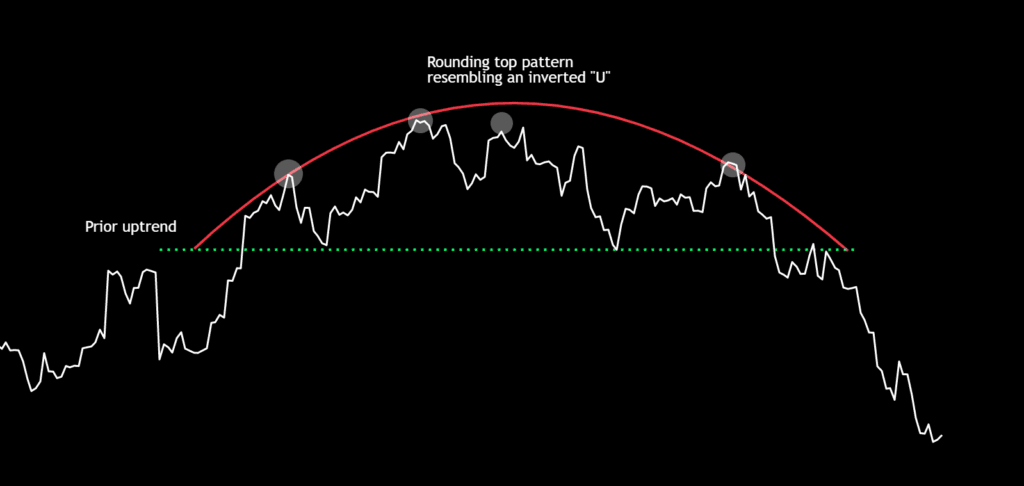
- A rounding top is a bearish reversal pattern that resembles the shape of an inverted “U” and signals a potential shift in market sentiment.
- Rounding top patterns typically emerge at the end of prolonged uptrends, signifying a possible trend reversal.
- The pattern is also known as a saucer top, owing to its similarity to an inverted saucer.
- Ideally, volume and price movements should be in sync, but in reality, these correlations can vary significantly.
- As the price descends from the neckline, it indicates underlying weakness and suggests that the asset may be entering a new downtrend.
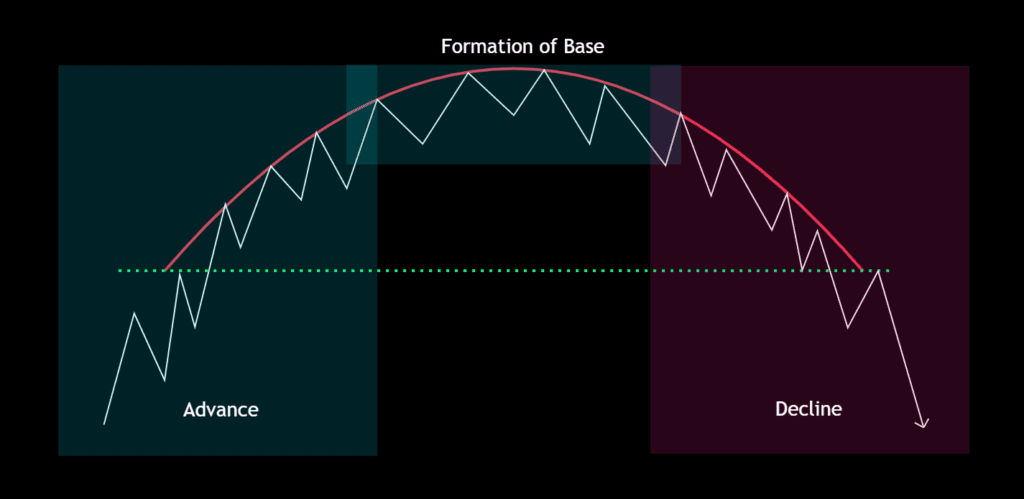
Components of a rounding top pattern:
The formation of a rounding top pattern can be divided into 3 important phases, which are:
- Advance
- Formation of base
- Decline
Important aspects:
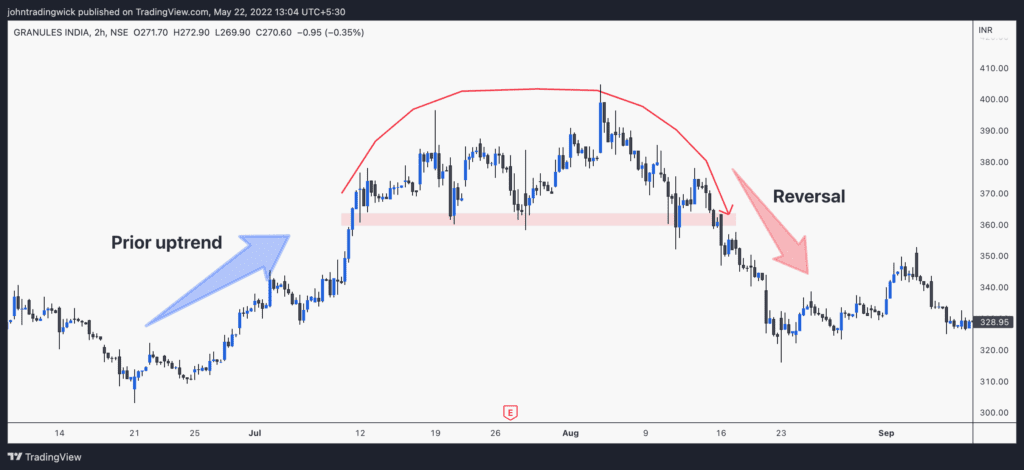
1. Prior Trend
The pattern must be preceded by a significant upward movement, indicating a bullish sentiment in the market.
2. Advance
The price advance leading to the formation of the pattern’s base/peak can manifest in various ways. In some instances, the upward movement may be characterized by numerous whipsaws or fluctuations, while in other cases, the price may simply experience a period of relatively low volatility before reaching the high. In any case, the price should form a rounded shape as the trend transitions from bullish to bearish.
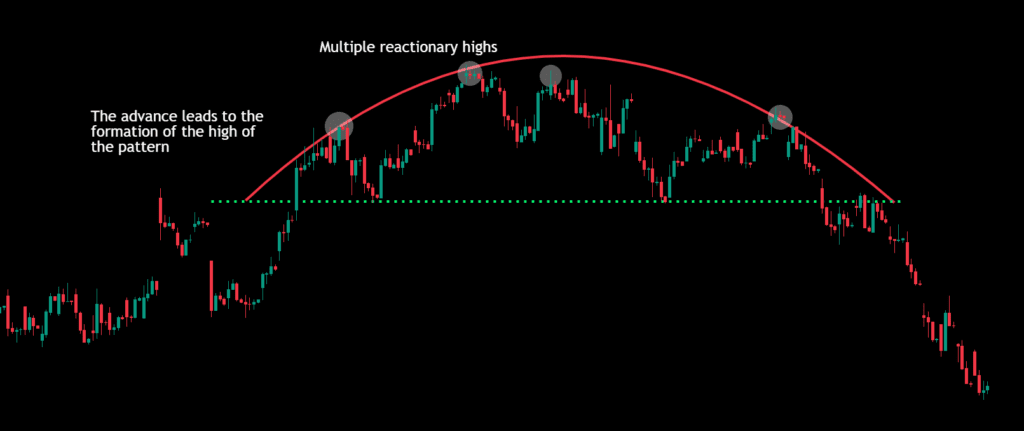
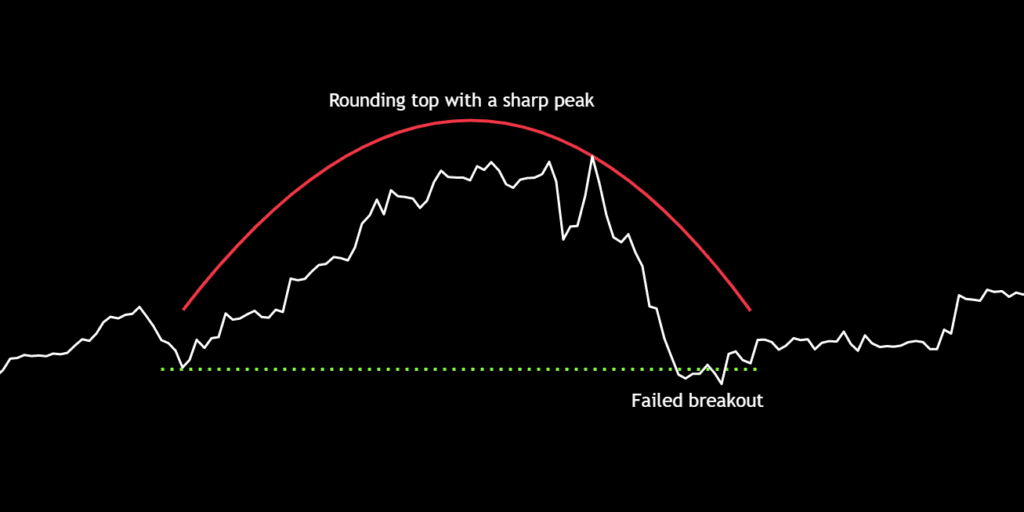
3. High
While the rounding top pattern generally resembles an inverted “U” shape, it can also take the form of an inverted “V” or “M”. Nevertheless, the peak should not be too sharp. Additionally, there is always a possibility of a new high due to an upthrust or buying climax.
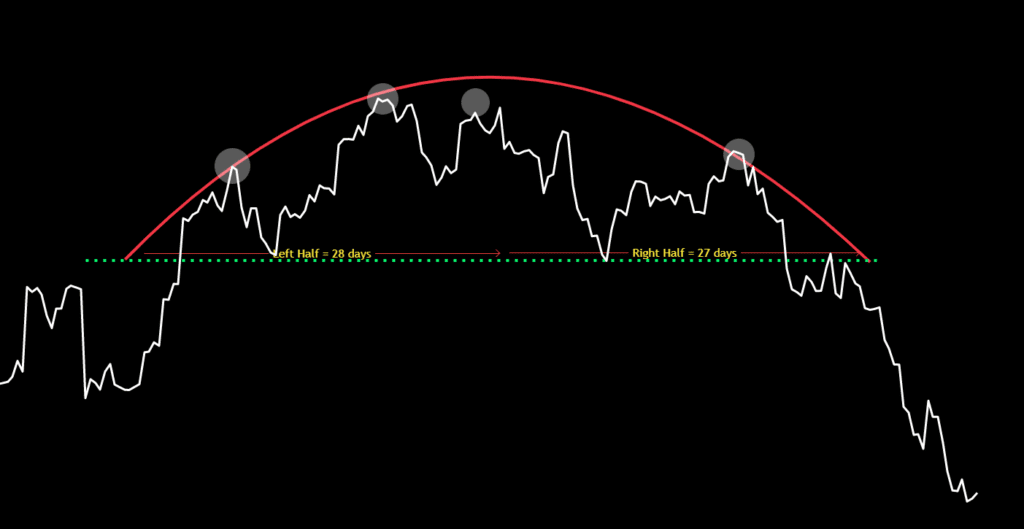
4. Decline
Typically, the development of the rounding top’s right half mirrors the timeframe of its left half, resulting in a balanced pattern. This implies that the duration of the price decline should be roughly equal to that of the preceding upswing. In layman’s terms, the formation of the right half of the pattern should take about the same amount of time as the left half.
Furthermore, the downward price movement should not be overly abrupt, as a steep decline could indicate a potential bear trap.
5. Breakdown
A breakdown below the reaction lows and the neckline is a bearish confirmation of the rounding top pattern. Once the price breaks below the neckline or support level, accompanied by increased trading volume, the rounding top pattern is considered complete, and a bearish trend is expected to follow. The price may return to the neckline to test the supply before continuing downwards.
6. Volume
Ideally, the trading volume should decrease as the pattern forms and increase when the price breaks below the support level, confirming the bearish reversal. It is important to note that these guidelines are not absolute and should not be interpreted too rigidly.
Volume levels will track the shape of an inverted rounding top:
– High during the up move
– Low during the formation of the base
– Rising during the down move
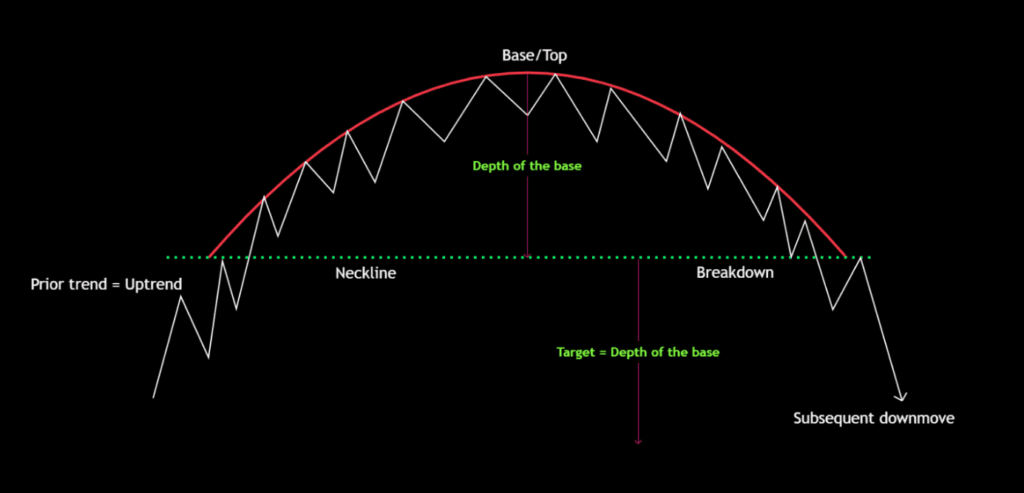
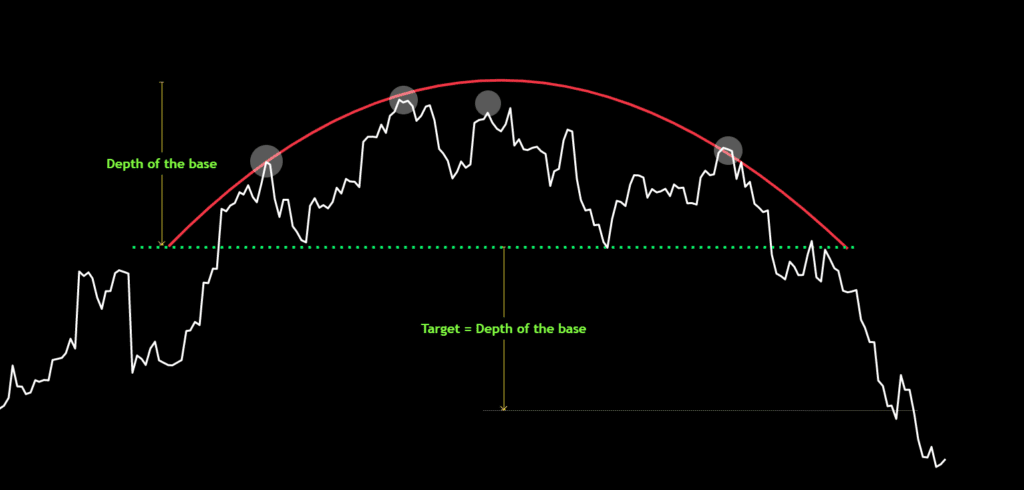
7. Target
Employing the measurement objective technique, the price target is determined to be equivalent to the depth of the pattern’s base. This can be calculated by measuring the vertical distance between the lowest point of the base and the neckline, which serves as a crucial reference level for the rounding top pattern.
8. Stop-loss
Ideally, a stop-loss order should be positioned at the highest point of the pattern’s base. However, if the price has oscillated multiple times near the neckline, creating a series of swing highs and lows, then the stop-loss can also be placed above the most recent swing high.
Exhibits
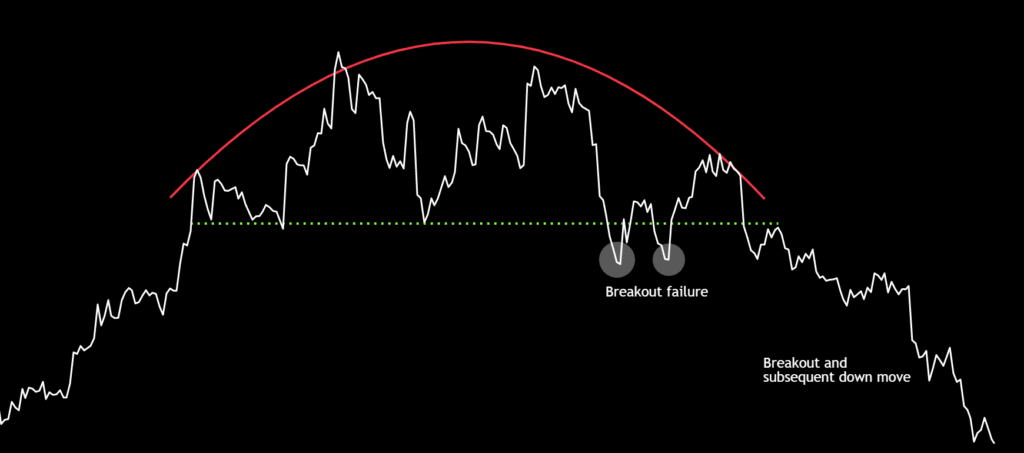
Rounding top pattern with a failed breakout
Rounding top pattern with a steep base
Rounding top pattern with a shallow base
Like this article? Don’t forget to share it! Follow me on Twitter and YouTube for more educational content.